<!-- Rectangle -->
<div>Rectangle</div>
<svg width="200" height="200">
    <rect x="5" y="5" width="190" height="190" fill="#1e90ff"></rect>
</svg>


<!-- Line -->
<div>Line</div>
<svg height="200" width="200">
    <line x1="0" y1="0" x2="200" y2="200" style="stroke:rgb(255,0,0);stroke-width:2" />
</svg>


<!-- Circle -->
<div>Circle</div>
<svg height="200" width="200">
    <circle cx="100" cy="100" r="45" stroke="#333" stroke-width="2" fill="orange" />
</svg>


<!-- Text -->
<div>Text</div>
<svg height="200" width="250">
    <text x="10" y="120" font-family="sans-serif" font-size="25" style="fill: #333;">SVG Text Example</text>
</svg>


<!-- Polyline -->
<div>Polyline</div>
<svg height="200" width="200">
    <polyline points="10 35, 30 10, 50 35" stroke="green" fill="transparent" stroke-width="2" />
</svg><canvas id="myCanvas" width="800" height="800"></canvas>var canvas = document.getElementById('myCanvas');
var context = canvas.getContext('2d');
context.fillStyle = '#c00';
context.fillRect(10, 10, 100, 100);attributes/update it/etc. This is built upon the statefulness of svg - we can re-select a circle and modify it or access its properties.enter/update/exit cycle (or basic append statements) are needed for svg in idiomatic D3 : we need to enter elements to see them and we style them often based on their datum. With canvas, we don't need to enter anything, same with exiting/updating. There are no elements to append in order to see, so we can draw visualizations without the enter/update/exit or the append/insert approaches used in d3 svg visualizations.import {select} from "d3-selection";
import {JSDOM} from "jsdom";
const jsdom = new JSDOM(html);
const svg = select(jsdom.window.document.body).append("svg");import * as d3 from "d3";​import * as d3 from "d3";
import * as d3GeoProjection from "d3-geo-projection";import {select, selectAll} from "d3-selection";
import {geoPath} from "d3-geo";
import {geoPatterson} from "d3-geo-projection";
import "d3-transition";.join method :.join(
function(enter) {
...
},
function(update) {
...
},
function(exit) {
...
}
).join method returns a selection containing the entering and existing elements (it doesn’t contain exiting elements). Typically most of your style and attribute updates will follow the .join method..join(
function(enter) {
return enter.append('circle');
}
).join('circle'). .style and .attr on the enter selection. This allows you to modify style and attributes of the entering elements..join(
function(enter) {
return enter
.append('circle')
.style('opacity', 0);
}
).join(
function(enter) {
return enter
.append('circle')
.style('opacity', 0);
},
function(update) {
return update.style('opacity', 1);
}
).join(
function(enter) {
return enter
.append('circle')
.style('opacity', 0);
},
function(update) {
return update
.style('opacity', 1);
},
function(exit) {
return exit.remove();
}
)| Method | Description |
|---|---|
| d3.select(css-selector) | Returns the first matching element in the HTML document based on specified css-selector |
| d3.selectAll(css-selector) | Returns all the matching elements in the HTML document based on specified css-selector |
<div class="container">
    <h2>Select DOM Elements using D3</h2>
    <section id="chart">
        <div class="item">Barot Bellingham</div>
        <div class="item">Hassum Harrod</div>
        <div class="item">Jennifer Jerome</div>
        <div class="item">Richard Tweet</div>
        <div class="item">Lorenzo Garcia</div>
        <div class="item">Xhou Ta</div>
    </section>
</div>
d3.selectAll('.item:nth-child(2n)')
.style("color", "green");| Scale Type | Method | Description |
|---|---|---|
| Continuous | d3.scaleLinear() | Construct continuous linear scale where input data (domain) maps to specified output range. |
| d3.scaleIdentity() | Construct linear scale where input data is the same as output. | |
| d3.scaleTime() | Construct linear scale where input data is in dates and output in numbers. | |
| d3.scaleLog() | Construct logarithmic scale. | |
| d3.scaleSqrt() | Construct square root scale. | |
| d3.scalePow() | Construct exponential scale. | |
| Sequential | d3.scaleSequential() | Construct sequential scale where output range is fixed by interpolator function. |
| Quantize | d3.scaleQuantize() | Construct quantize scale with discrete output range. |
| Quantile | d3.scaleQuantile() | Construct quantile scale where input sample data maps to discrete output range. |
| Threshold | d3.scaleThreshold() | Construct scale where arbitrary input data maps to discrete output range. |
| Band | d3.scaleBand() | Band scales are like ordinal scales except the output range is continuous and numeric. |
| Point | d3.scalePoint() | Construct point scale. |
| Ordinal | d3.scaleOrdinal() | Construct ordinal scale where input data includes alphabets and are mapped to discrete numeric output range. |
<div class="container">
    <h1>D3 Color Scales</h1>
    <div id="chart"></div>
</div>
var bardata = [90, 45, 25, 15, 10, 7];
var height = 400,
width = 600,
barWidth = 50,
barOffset = 5;
var colors = d3.scale.linear()
.domain([0, bardata.length])
.range(['#C61C6F', '#B58929']);
var yScale = d3.scale.linear()
.domain([0, d3.max(bardata)])
.range([0, height]);
var xScale = d3.scale.ordinal()
.domain(d3.range(0, bardata.length))
.rangeBands([0, width]);
d3.select('#chart').append('svg')
.attr('width', width)
.attr('height', height)
.style('background', '#C9D7D6')
.selectAll('rect').data(bardata)
.enter().append('rect')
.style('fill', function (d, i) {
return colors(i);
})
.attr('width', xScale.rangeBand() - 10)
.attr('height', function (d) {
return yScale(d);
})
.attr('x', function (d, i) {
return xScale(i);
})
.attr('y', function (d) {
return height - yScale(d);
});D for Domain, D for Data.d3.svg.line()d3.svg.line() - create a new line generatord3.svg.line.radial() - create a new radial line generatord3.svg.area() - create a new area generatord3.svg.area.radial() - create a new radial area generatord3.svg.arc() - create a new arc generatord3.svg.symbol() - create a new symbol generatord3.svg.chord() - create a new chord generatord3.svg.diagonal() - create a new diagonal generatord3.svg.diagonal.radial() - create a new radial diagonal generator//The data for our line
var lineData = [ { "x": 1, "y": 5}, { "x": 20, "y": 20},
{ "x": 40, "y": 10}, { "x": 60, "y": 40},
{ "x": 80, "y": 5}, { "x": 100, "y": 60}];
//This is the accessor function we talked about above
var lineFunction = d3.svg.line()
.x(function(d) { return d.x; })
.y(function(d) { return d.y; })
.interpolate("linear");
//The SVG Container
var svgContainer = d3.select("body").append("svg")
.attr("width", 200)
.attr("height", 200);
//The line SVG Path we draw
var lineGraph = svgContainer.append("path")
.attr("d", lineFunction(lineData))
.attr("stroke", "blue")
.attr("stroke-width", 2)
.attr("fill", "none");var numbers = [15, 8, 42, 4, 32];on() method adds an event listener to all selected DOM elements.d3.selection.on(type[, listener[, capture]]);| Event Methods | Description |
|---|---|
| selection.on() | Add or remove event listeners to capture event types like click, mouseover, mouseout etc. |
| selection.dispatch() | Captures event types like click, mouseover, mouseout. Typenames is the eventname, listener is the event listener |
| d3.event | Event object to access standard event fields such as timestamp or methods like preventDefault |
| d3.mouse(container) | Gets the x and y coordinates of the current mouse position in the specified DOM element. |
| d3.touch() | Gets the touch coordinates to a container |
<!doctype html>
<html>
<head>
    <style>
        div {
            height: 100px;
            width: 100px;
            background-color: steelblue;
            margin: 5px;
        }
    </style>
    <script src="https://d3js.org/d3.v4.min.js"></script>
</head>
<body>
<div> </div>
<script>
    d3.selectAll("div")
      .on("mouseover", function(){
          d3.select(this)
            .style("background-color", "orange");

          // Get current event info
          console.log(d3.event);

          // Get x & y co-ordinates
          console.log(d3.mouse(this));
      })
      .on("mouseout", function(){
          d3.select(this)
            .style("background-color", "steelblue")
      });
</script>
</body>
</html>> formatDate = d3.time.format("%b-%Y")
> formatDate(parseDate('2020-02-02'))
"Feb-2020"d3.polygonArea() method returns the signed area of the specified polygon. If the vertices of the polygon are in counterclockwise order (assuming a coordinate system where the origin ⟨0,0⟩ is in the top-left corner), the returned area is positive; otherwise it is negative, or zero.var d = [
[-1, 415.44],
[146.93, 304.47],
[195.45, 152.13],
[-1, 134.64]
];
var area = d3.polygonArea(d);
console.log(area) // Output: 36157.2759var svg = d3.select('body').append('svg')
.attr('width', width)
.attr('height', height)
.on('mousemove', function() {
console.log( d3.event.clientX, d3.event.clientY ) // log the mouse x,y position
});.svg-container {
display: inline-block;
position: relative;
width: 100%;
padding-bottom: 100%; /* aspect ratio */
vertical-align: top;
overflow: hidden;
}
.svg-content-responsive {
display: inline-block;
position: absolute;
top: 10px;
left: 0;
}
svg .rect {
fill: gold;
stroke: steelblue;
stroke-width: 5px;
}<script src="https://cdnjs.cloudflare.com/ajax/libs/d3/5.7.0/d3.min.js"></script>
<div id="chartId"></div>d3.select("div#chartId")
.append("div")
// Container class to make it responsive.
.classed("svg-container", true)
.append("svg")
// Responsive SVG needs these 2 attributes and no width and height attr.
.attr("preserveAspectRatio", "xMinYMin meet")
.attr("viewBox", "0 0 600 400")
// Class to make it responsive.
.classed("svg-content-responsive", true)
// Fill with a rectangle for visualization.
.append("rect")
.classed("rect", true)
.attr("width", 600)
.attr("height", 400);var zoom = d3.zoom().on("zoom", zooming);
vis = svg.append("svg:svg")
.attr("width", width)
.attr("height", height)
.call(zoom) // here
.call(zoom.transform, d3.zoomIdentity.translate(100, 50).scale(0.5))
.append("svg:g")
.attr("transform","translate(100,50) scale(.5,.5)");d3.js command d3.interpolateObject(a,b) is used. Object interpolation is useful particularly for data space interpolation, where data is interpolated rather than attribute values. d3.xml(url[mimeType][,callback]) XML file can be called. This command will create a request for the XML file at the specified url. If a call back is declared, the request will be immediately processed with the GET method and the call back will be invoked when the file is loaded, or request fails. x: y = mx + b.var data = [
{"ORDER": 1, "apples": 3840, "bananas": 1920, "cherries": 960},
{"ORDER": 2, "apples": 1600, "bananas": 1440, "cherries": 960},
{"ORDER": 3, "apples": 640, "bananas": 960, "cherries": 640},
{"ORDER": 4, "apples": 320, "bananas": 480, "cherries": 640}
];
var h = 200;
var w = 200;
var svg = d3.select('body').append('svg').attr('width',w).attr('height',h);
var g = svg.append('g');
var x = d3.scaleBand().rangeRound([0, w-50]);
var y = d3.scaleLinear().range([h-50, 0]).domain([0,10000]);
var color = ['#bae4bc','#7bccc4','#43a2ca'];
var stack = d3.stack()
.keys(["apples", "bananas", "cherries"])
.order(d3.stackOrderNone)
.offset(d3.stackOffsetNone);
var series = stack(data);
x.domain(data.map(function(d) { return d.ORDER; }));
g.append("g")
.selectAll("g")
.data(series)
.enter().append("g")
.attr("fill", function(d,i) { return color[i]; })
.selectAll("rect")
.data(function(d) { return d; })
.enter().append("rect")
.attr("x", function(d) { return x(d.data.ORDER); })
.attr("y", function(d) { return y(d[1]); })
.attr("height", function(d) { return y(d[0]) - y(d[1]); })
.attr("width", x.bandwidth());d3.js you can use the command selection.data([values[,key]]). The values here specifies the data for each group in the selection while a key function determines how data is connected to elements. | Method | Description |
|---|---|
| selection.transition() | this schedules a transition for the selected elements |
| transition.duration() | duration specifies the animation duration in milliseconds for each element |
| transition.ease() | ease specifies the easing function, example: linear, elastic, bounce |
| transition.delay() | delay specifies the delay in animation in milliseconds for each element |
<!doctype html>
<html>
<head>
    <style>
        #container {
            height: 100px;
            width: 100px;
            background-color: black;

        }
    </style>
<script src="https://d3js.org/d3.v4.min.js"></script>
</head>
<body>
<div id="container"></div>
<script>
    d3.select("#container")
      .transition()
      .duration(1000)
      .style("background-color", "red");
</script>
</body>
</html><g> and </g>. selection.classed({ 'foo':true, 'bar': false})d3.js isvar xAxis = d3.svg.axis().| Axis Method | Description |
|---|---|
| d3.axisTop() | Creates top horizontal axis. |
| d3.axisRight() | Creates vertical right-oriented axis. |
| d3.axisBottom() | Creates bottom horizontal axis. |
| d3.axisLeft() | Creates left vertical axis. |
<div class="container">
    <h1>Axes in D3</h1>
    <div id="chart"></div>
</div>
var width = 500, height = 500;
var data = [10, 20, 30, 40, 50];
var svg = d3.select("body")
.append("svg")
.attr("width", width)
.attr("height", height);
var xscale = d3.scaleLinear()
.domain([0, d3.max(data)])
.range([0, width - 100]);
var yscale = d3.scaleLinear()
.domain([0, d3.max(data)])
.range([height/2, 0]);
var x_axis = d3.axisBottom()
.scale(xscale);
var y_axis = d3.axisLeft()
.scale(yscale);
svg.append("g")
.attr("transform", "translate(50, 10)")
.call(y_axis);
var xAxisTranslate = height/2 + 10;
svg.append("g")
.attr("transform", "translate(50, " + xAxisTranslate +")")
.call(x_axis);Output : 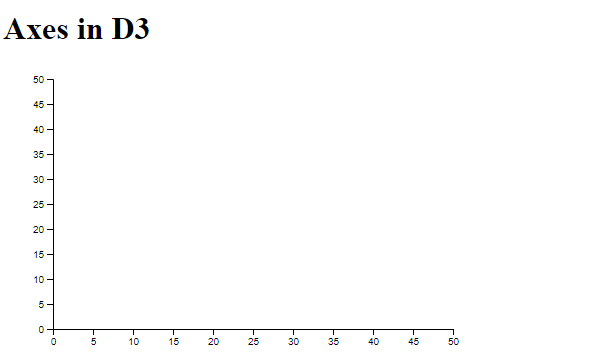
| D3.js | JQuery |
|---|---|
| D3 creates or manipulates data-driven document that is manipulating or creating visual documents from your data using D3’s data/exit/enter methods | JQuery is a general purpose Ajax/js library which offers general Ajax/js functionalities for creating web apps, but it does not provide data-driven functionality of D3 |
| D3 has numerous visualization extensions | jQuery has many general web app extensions |
data () function is used to join the specified array object of data to the selected DOM elements and return updated selection.data() function : This function Joins the data to the selected elementsenter() function : This functions is used to creates a selection with placeholder references for missing elementsexit() function : This functions is used to removes nodes and adds them to the exit selection which can be later removed from the DOMdatum() function : This functions is used to injects data to the selected element without computing a joinvar dataArray = ["Hello, Ths is data array!"];
var selectData = d3.select("body").selectAll("p").data(dataArray)
.text(function (dt) {
return dt;
});