Google News
logo
R Programing Interview Questions
1 .
R is an interpreted computer programming language which was created by Ross Ihaka and Robert Gentleman at the University of Auckland, New Zealand. It is a software environment used to analyze statistical information, graphical representation, reporting, and data modeling. R is the implementation of the S programming language, which is combined with lexical scoping semantics.
Broadly speaking these are Data Structures available in R :

Data Structures in R

Data Structure Description
Vector vector is a sequence of data elements of the same basic type. Members in a vector are called components.
List Lists are the R objects which contain elements of different types like − numbers, strings, vectors or another list inside it.
Matrix matrix is a two-dimensional data structure. Matrices are used to bind vectors from the same length.  All the elements of a matrix must be of the same type (numeric, logical, character, complex).
Dataframe A data frame is more generic than a matrix, i.e different columns can have different data types (numeric, character, logical, etc). It combines features of matrices and lists like a rectangular list.
 
R  programming Language Python programming language
Model Building is similar to  Python Model Building is similar to R.
Model Interpretability is  good Model Interpretability is  not good
Production is not better than Python. Production is good
R has good community support over Python. Community Support  is not better than R
Data Science Libraries are same as Python. Data Science Libraries are same as R.
R has good data visualizations libraries and tools Data visualization is not better than R
R has a steep learning curve. Learning Curve in Python is easier than learning R.
R provides to import data in R language. To begin with the R commander GUI, user should type the commands in the command Rcmdr into the console. Data can be imported in R language in 3 ways such as:
 
* Select the data set in the dialog box or enter the name of the data set as required.
* Data is entered directly using the editor of R Commander via Data->New Data Set. This works good only when the data set is not too large.
* Data can also be imported from a URL or from plain text file (ASCII), or from any statistical package or from the clipboard.
Loading a .csv file in R is quite easy.

All you need to do is use the “read.csv()” function and specify the path of the file.

house<-read.csv("C:/Users/John/Desktop/house.csv")
Combine the data, code and analysis results in a single document using knitr for Reproducible research done. Helps to verify the findings, add to them and engage in conversations. Reproducible research makes it easy to redo the experiments by inserting new data values and applying it to different various problems.
There are the following packages which are used for data imputation
 
* MICE
* missFores
* Mi
* Hmisc
* Amelia
* imputeR
In iris dataset, there are five columns, i.e., Sepal.Length, Sepal.Width, Petal.Length, Petal.Width and Species. We will calculate the mean of Sepal-Length across different species of iris flower using the mean() function from the mosaic package.
 
mean(iris$Sepal.Length~iris$Species)
A valid variable name consists of letters, numbers and the dot or underline characters. The variable name starts with a letter or the dot not followed by a number.
A matrix is always two dimensional as it has only rows and columns. But an array can be of any number of dimensions and each dimension is a matrix. For example a 3x3x2 array represents 2 matrices each of dimension 3x3.
A random walk is the simplest example of a non-stationary process. A random walk has no specified mean or variance, strong dependence over time, and its changes or increments are white noise. Simulating random walk in R :

arima.sim(model=list(order=c(0,1,0)),n=40)->rw ts.plot(rw)
It is a basic time series model and a simple example of a stationary process. A white noise model has a fixed constant mean, a fixed constant variance, and no correlation over time. We can simulate a white noise model in the following way :
 
arima.sim(model=list(order=c(0,0,0)),n=50)->wn
Simple and effective programming language.

* It is a data analysis software.
* It gives effective storage facility and data handling.
* It gives high extensible graphical techniques.
* It is an interpreted language.
Broadly speaking these are different components in grammar of graphics :
 
* Data layer
* Aesthetics layer
* Geometry layer
* Facet layer
* Co-ordinate layer
* Themes layer
RMarkdown is a reporting tool provided by R. With the help of Rmarkdown, you can create high quality reports of your R code. 
 
The output format of Rmarkdown can be :
 
* HTML
* PDF
* WORD
 
library() require()
Library() function gives an error message display, if the desired package cannot be loaded. Require() function is used inside function and throws a warning messages whenever a particular package is not Found
It loads the packages whether it is already loaded or not, It just checks that it is loaded, or loads it if it isn’t (use in functions that rely on a certain package). The documentation explicitly states that neither function will reload an already loaded package.

Consider a related program for the above differentiation.
if(!require(package, character.only=T, quietly=T)) {

install.packages (package)

library(package, character.only=T)

}
 
For multiple packages you can use
for(package in c('', '')) {

if(!require(package, character.only=T, quietly=T)) {

install.packages (package)

library(package, character.only=T)

}
}
It is used to determine that the means of two groups are equal or not by using t.test() function.
T Test()
 
The disadvantages are :
 
* Lack of standard GUI
* Not good for big data.
* Does not provide spreadsheet view of data.
with() function applies an expression to a dataset.
#with(data,expression)

By() function applies a function t each level of a factors.
#by(data,factorlist,function)
The solutions available are referred to as “packages” in R, so be sure to use this term in your answer. First, explain that the CRAN package ecosystem has an extensive amount of packages available (over 6,000) to solve potential issues. Each R user might have their own way of making their selection, but the best way to answer this question is to explain how reviews from others go a long way: Were other R users with similar issues able to solve their problems with a particular package? If so, were these issues similar to the problems you’re encountering? In your answer, explain that you’d be wary of packages that don’t encompass good software development principles, have poor reviews, or are lacking reviews altogether.
With just about any program out there, there are going to be advantages and disadvantages. Your interviewer is not necessarily looking for all of the pros and cons, nor is he or she necessarily expecting you to name specific features. Your interviewer is just using this as another question to test the extent of your knowledge, so be sure to know some pros and cons before heading into your interview. For example, you can say that many programmers like R because it’s free, widely accessible, and has built-in functionality via R packages. For disadvantages, you may want to point out that there are some security flaws, and that it is also open-source, which some people even consider a disadvantage. Keep it simple by thinking about what you personally like about R, and what you don’t.
Subset() is used to select the variables and observations and sample() function is used to  generate  a random sample of the size n from a dataset.
Dataframe can contain different type of data but matrix can contain only similar type of data. Here are the different types of data structures in R:

matrix and dataframes
There are various applications available in real-time. These applications are as follows :
 
* Google
* Twitter
* Facebook
* HRDAG
* NDAA
RStudio is an integrated development environment which allows us to interact with R more readily. RStudio is similar to the standard RGui, but it is considered more user-friendly. This IDE has various drop-down menus, windows with multiple tabs, and so many customization processes. The first time when we open RStudio, we will see three Windows. The fourth Window will be hidden by default.
This is the package which is loaded by default when R environment is set. It provides the basic functionalities like input/output, arithmetic calculations etc. in the R environment.
Logistic regression deals with measuring the probability of a binary response variable. In R the function 
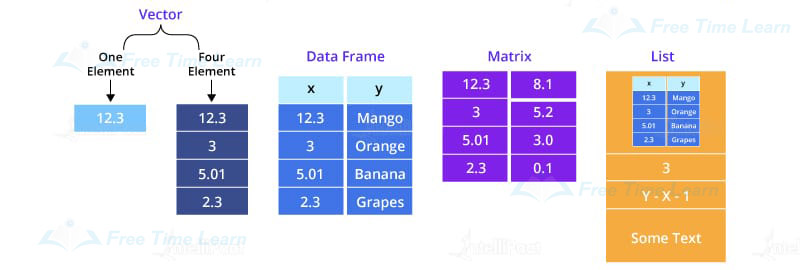
glm() is used to create the logistic regression.
General format is :
 
Mymatrix< - matrix (vector, nrow=r , ncol=c , byrow=FALSE,
dimnames = list ( char_vector_ rowname, char_vector_colnames))
Use the code
myTable = data.frame()
edit(myTable)
The applied family of functions is a built-in family which appears with the built-in packages in R. It is already installed in it. 
 
It allows us to manipulate data frames, vectors, arrays, etc. It works more effectively than loops and also gives better performance from them which is faster at the execution level. It reduces the need for explicitly creating a loop in R.   
 
The list of the apply family are as follows :
 
apply() function : It helps to apply a function on rows or columns of a data frame. 
Syntax : apply()
 
lapply() function : It takes a list as an argument and applies a function to each element of the list by looping. 
Syntax : lappy()
 
sapply() function : It is more advanced version than lappy() however it works same as lappy(). It also takes a list as an argument and applies a function to each element of the list by looping. The only difference is in output generalization. Where lappy() returns a list as an output every time, sapply returns certain algorithms as output.
Syntax :  sapply()
 
tapply() function : It can be applied to vectors and factors. The data which contain different subgroup and we have to apply a specific function on each subgroup that time we can use it. 
Syntax : tapply()
 
mapply() function : It is a multivariate version of the sapply() function where we apply the same function to multiple arguments.
Syntax : mapply()
The functions which are available in the “dplyr” package are as follows :
 
Select() function : Allows us to rapidly zoom in on a useful subset using operations that usually only work on numeric variable positions.

group_by() function :
It allows us to group by a modified columns. 

mutate() function :
It is useful to add new columns that are functions of previous existing columns. 

filter() function :
Allows us to select a subset of rows in a data frame. 

summarize() function :
Allows us to collapses a data frame to a single row.

relocate() function :
Allows us to change the column order. 

slice() function :
Allows us to select, remove and duplicate rows.

desc() function :
Allows us to arrange the column in descending order.
It is a table that is used to describe the classification model performance on a set of test data for which the true values are known. It is very simple to understand but only the related terms can be confusing. Confusion Matrix allows us to find the measure recall, accuracy, precision, etc. It visualizes the accuracy of a classifier by comparing the actual and predicted classes. The binary confusion matrix is composed of squares: 
 
True Positive (TP) : It predicts values correctly predicted as actual positive.
 
True Negative (TN) : It predicts values correctly predicted as an actual negative. 
 
False Positive (FP) : It predicts values incorrectly predicted as actual positive. 
 
False Negative (FN) : It predicts values correctly predicted as negative. 
A data scientist will use next to skip an iteration in a loop. As an example :
> val1 <- 1:30
> for(val in val1){
+ if(val == 25){
+ next
+ }
+ print(val)
+ }
This piece of code will iterate through the numbers from 1 to 30. It will skip 25 as we have used the next statement to skip the iteration from which we move on to the next value. We will obtain the output from 1-24 and 26-30.
34 .
Differentiate b/w "%%" and "%/%".
The "%%" provides a reminder of the division of the first vector with the second, and the "%/%" gives the quotient of the division of the first vector with the second.
This function is used to give the maximum likelihood fitting of univariate distribution and defined under the MASS package.
The GGobi is an open-source program for visualization to exploring high dimensional typed data, and the iPlots is a package which provides bar plots, mosaic plots, box plots, parallel plots, histograms, and scatter plots.
These three functions are responsible for
 
* The role of is.atomic is to test if the vector is atomic in nature.
* Is.numeric checks if the object has an integer or a double type and does not belong to “factor”, “Data”, “POSIXt” or “difftime” class.
* is.vector() is responsible for testing if the object is vector and therefore, has no attributes excluding names.
38 .
How to print something in R? <Practice of R basic syntax>
To write something, R uses print command.
>string_variable_name <- “R is an analytical language”
>print(string_variable_name)
We can do a cross-product of two tables in R by using CJ() function. It produces data. table out of the two vectors. This function does the Cartesian Product or Cross product of two data. tables. 
We extract a word from a string by using the word() function in the R language. This function is mainly used for the extracted word from a string that is from the position that is specified as an argument.  We can use String, start, end, sep, etc. as an argument. 
To evaluate the association between two or more variables we use Correlation. It has Correlation coefficients which are indicators of the strength of the linear relationship between two different variables say x and y. The correlation coefficient greater than zero indicates that a positive relationship, while a value less than zero indicates that a negative relationship. A negative correlation is also called inverse correlation which is a key concept in the creation of diversified portfolios that can better withstand portfolio volatility. 
 
The most common Correlation coefficient is generated by the Pearson product-moment correlation which is used to measure the linear relationship between two variables. The Pearson Correlation is also called parametric correlation. 
Seq(4) means vector from 1 to 4 (c(1,2,3,4)) whereas seq_along(4) means a vector of the  length(4) or 1(c(1)).
There are 5 types of sorting algorithms are used which are :
 
* Bubble Sort
* Selection Sort
* Merge Sort
* Quick Sort
* Bucket Sort
There are many ways to export the data into another formats like SPSS, SAS , Stata , Excel Spreadsheet.
Save command is used for storing R objects into a file.
 
Syntax : >save(z,file=”z.Rdata”)
load command is used for storing R objects from a file.
 
Syntax : >load(”z.Rdata”)
UIWindow object coordinates the one or more views presenting on the screen.
UIWindow
Some packages used for data mining in R :
 
data.table - provides fast reading of large files

rpart and caret -
for machine learning models.

Arules -
for associaltion rule learning.

GGplot -
provides varios data visualization plots.

tm -
to perform text mining.

Forecast -
provides functions for time series analysis
The cluster.stats() function define in the fpc package that provides a method for comparing the similarity of two cluster solutions using different validation criteria, and the pvclust() function is defined in the pvclust package that provides p-values for hierarchical clustering.
 
This function defines in the mvnormtest package and produces the Shapiro-wilk test to multivariate normality. The barlett.test() is used to provide a parametric k-sample test of the equality of variances.
The qda() function prints a quadratic discriminant function while lda() function print the discriminant functions based on the centered variable.
The auto.arima() function handle both the seasonal and non-seasonal ARIMA model and the principal() function used for rotating and extracting the principal components.
In oops, the S3 is used to overload any function. So that we can call the functions with different names, and it depends on the type of input parameter or the number of parameters, and the S4 is the most important characteristic of oops. However, this is a limitation, as it is quite difficult to debug. There is an optional reference class for S4.
It is used to install a r package from local directory by browsing and selecting the file.
abline() function is add the reference line to a graph.
 
Syntax : abline(h=yvalues, v=xvalues)
Any metric which is measured over regular time intervals creates a time series. Analysis of time series is commercially important due to industrial necessity and relevance, especially with respect to the forecasting (demand, supply, and sale, etc.). A series of data points in which each data point is associated with a timestamp is known as time series.
R programming language has several libraries for creating charts and graphs. A pie-chart is a representation of values in the form of slices of a circle with different colors.
The Chi-Square Test is used to analyze the frequency table (i.e., contingency table), which is formed by two categorical variables. The chi-square test evaluates whether there is a significant relationship between the categories of the two variables.
There are the following packages of visualization in R :
 
* Plotly
* ggplot2
* tidyquant
* geofacet
* googleVis
* Shiny
The data frame is a list of vectors of equal length. It can consist of any vector with a particular type and can combine it into one. So, a data frame can have a vector of logical and another of numeric. The only condition is that all the vectors should have the same length.
#This is how the data frame is created
> student_profile <- data.frame(
Name <-c(“Ray”, “Green”, “Justin”)
Age <- c(22,23,24)
Class <- c(6,7,8)
)
print(stuent_profile)
The above code will create three columns with the columns name as name, age, and class.
It is used to find the model outputs for specified inputs. This is identical to the general predict() function, except it will choose sensible values by default. This simplifies to get a quick look at the model values. There are several arguments of it like model, data, on_training, nlevels, at, etc. This function is set up to look easily at typical outputs. 
The “initialize()” function is used internally by some imputation algorithms for finding the missing values which are imputed with the mean for vectors of class “numeric”, also with the median for the vector of class “integers” and last but not least the mode for vectors of class “factor”. It initializes the missing values through a rough estimation of missing values in a vector according to its type. 
We can find the mean of one column concerning another by using ColMeans() function along with sapply() function. It is always helpful to find the mean of the multiple columns. Wed can also find the mean of multiple columns through Dplyr functions. summarise_if() function along with is.numeric() function is used to get the mean of the multiple column. With the help of the summarise_if() function, the mean of numeric columns of the data frame is calculated.
There are many examples of the functions of Stringr from which the main examples are as follows :
 
Str_count() : It count the number of patterns. Syntax= str_count(x, pattern) 

Str_locate() : It  gives the location or position of the match. Syntax= str_locate(x, pattern)

Str_extract() : It extract the text of the match. Syntax= Str_extract(x, pattern)

Str_match() : It extract parts of the match defined by parenthesis.  Syntax = str_match(x, pattern)

Str_split() : It splits a string into multiple pieces. Syntax = str_split(x, pattern)
Rattle is a popular GUI for data mining using R. It presents statistical and visual summaries of data, transforms data so that it can be readily modelled, builds both unsupervised and supervised machine learning models from the data, presents the performance of models graphically, and scores new datasets for deployment into production. A key features is that all of your interactions through the graphical user interface are captured as an R script that can be readily executed in R independently of the Rattle interface.
The conversion of the rows of the matrix in column and column of the matrix in a row is known as transpose. In R we can do it in two ways first by using the t() function and by iterating over each value using Loops.
If the seq() is called with the one unnamed numerical argument data of length 1, as a result, it returns an integer sequence from 1 to the value of the argument. In a question seq(4) is the command returns the integers 1,2,3,4. While seq_along(4) produces the vector of indices of a given factor. 
It is the function that is used to calculate the cox proportion hazards regression model in R. It is the time-dependent variables, time-dependent strata, multiple events per subject, and other extensions which are incorporated using the numerous process formulation. The data for a subject is presented as multiple rows or “observations”, each of which applies to an interval of observation (start, stop).
The corrgram() function produces a graphical display of a correlation matrix. Its cells can be shaded or colored to show the correlation value. In corrgram() function the non-numeric column in the data will be ignored.
Data cleaning is a process in analytics that involves removing or amending data in a database that is incorrect, incomplete, improperly formatted, or duplicated.
RDA file format : These are the R objects that are used to attaching and loading files in R.

.Rfiles : These are the files that are created inside the R editor by the dump function.

.txt files : The .txt files are used to store datasets. R uses theread.table() and write.table() function.

.csv files : The comma-separated values files are common data files.
Repeat loop executes a sequence of statements multiple times. It doesn’t put the condition at the same place where we put the keyword repeat.
 
Example :
>name <-c(“Peeter”,”Danny”)
>temp <-5
> repeat {
print(name)
temp <- temp +2
if(temp >11){
Break
}
}
This would return the name vector four times. First, it prints the name and increases the temperature to 7 and so on.
Decision making in R is performed in the same way as in other languages. The three main decision-making statements contain:
 
* If statement
* If.else statement
* Switch statement
outer join - merge (x= df1, y=df2, by= “id”, all= TRUE)
left join - merge (x= df1, y= df2, by = “id”, all.x = TRUE)
right join - merge (x= df1, y= df2, by = “id”, all.y = TRUE)
inner join - merge (x= df1, y= df2, by = “id”)
cross join - merge (x= df1, y= df2, by = NULL)
It is used to get aggregate after melt(). So, now we have data arranged in some order, if we want to aggregate the columns with similar company_name and age, then we should use the cast() function.
 
Example :
Casted_data_set <- cast(new_data_set, company_name+age ~ variable, sum)
The function gives the aggregate salary and number of children with the same company and age.
Scatterplot is a graph which shows many points plotted in the Cartesian plane. Each point holds two values that are present on the x-axis and y-axis. The simple scatterplot is plotted using plot() function.
 
The syntax for scatterplot is :
plot(x,y,main,xlab,ylab,xlim,ylim,axes)​


Where
 
x is the data set whose values are the horizontal coordinates
 
y is the data set whose values are the vertical coordinates
 
main is the tile in the graph
 
xlab and ylab is the label in the horizontal and vertical axis
 
xlim and ylim are the limits of values of x and y used in the plotting
 
axes indicate whether both axes should be there on the plot.
plot(x = input$wt,y = input$mpg,
xlab = “Weight”,
ylab = “Mileage”,
xlim = c(2.5,5)
ylim = c(15,30)
main = “Weight vs Mileage”
)
The sink() function defines the direction of the output.
#direct output to a file
sink(“myfile”, append = FALSE, split = FALSE)
#return output to the terminal sink()
The append option controls whether output overwrites or adds to a file. The split option determines if the output is also sent to the screen as the output file.