Google News
logo
Data Analyst Interview Questions
Data analysis is the process of inspecting, cleaning, transforming, and modeling data to uncover useful information, draw conclusions, and support decision-making. It involves various techniques and methods to understand the structure, patterns, and relationships within datasets.

Here's a breakdown of key components of data analysis :

Inspection : This involves exploring the dataset to understand its characteristics, such as the types of variables, data distributions, and potential outliers. Visualization techniques, such as histograms, scatter plots, and box plots, are often used to gain insights into the data.

Cleaning : Data cleaning is the process of identifying and correcting errors, inconsistencies, and missing values in the dataset. This step is crucial to ensure the accuracy and reliability of the analysis results.

Transformation : Data transformation involves converting the raw data into a suitable format for analysis. This may include standardizing variables, normalizing distributions, or creating new features through techniques like feature engineering.

Modeling : In data analysis, modeling refers to applying statistical or machine learning techniques to the data to uncover patterns, make predictions, or test hypotheses. Common modeling techniques include regression analysis, classification, clustering, time series analysis, and predictive modeling.

Interpretation : Once the analysis is complete, the findings need to be interpreted in the context of the problem or question being addressed. This involves drawing conclusions, identifying insights, and communicating the results effectively to stakeholders.

Data analysis is used across various domains and industries to gain insights, solve problems, optimize processes, and make informed decisions. It plays a critical role in fields such as business analytics, marketing research, scientific research, healthcare, finance, and many others. With the increasing availability of data and advancements in analytical tools and techniques, data analysis continues to be an essential skill for professionals in today's data-driven world.
Data mining and data analysis are both crucial components of the larger field of data science, but they serve different purposes and utilize different techniques. Here are the main differences between them :

1. Purpose :

* Data Mining : Data mining focuses on discovering patterns, relationships, and insights from large datasets. It involves extracting meaningful information from data to identify trends or anomalies that can be used for decision-making or predictive modeling.
* Data Analysis : Data analysis involves examining, cleaning, transforming, and modeling data to derive actionable insights and support decision-making. It aims to interpret the data and understand its underlying structure to answer specific questions or solve problems.


2. Techniques :

* Data Mining : Data mining techniques include clustering, classification, association rule mining, anomaly detection, and regression analysis. These techniques are used to uncover hidden patterns and relationships within the data.
* Data Analysis : Data analysis techniques encompass exploratory data analysis (EDA), statistical analysis, hypothesis testing, regression analysis, time series analysis, and data visualization. These techniques are employed to understand the characteristics and properties of the data, identify trends, and make inferences.

3. Scope :


* Data Mining : Data mining is often focused on discovering new knowledge or insights from large and complex datasets, especially in fields like machine learning, artificial intelligence, and pattern recognition.
* Data Analysis : Data analysis is broader in scope and can encompass various activities such as descriptive statistics, diagnostic analysis, predictive modeling, prescriptive analysis, and data visualization. It is used across industries and disciplines to extract useful information from data.


4. Goal :

* Data Mining : The primary goal of data mining is to uncover hidden patterns or relationships in the data that can be used to make predictions, identify opportunities, or gain a deeper understanding of a phenomenon.
* Data Analysis : The goal of data analysis is to interpret and make sense of the data to support decision-making, solve problems, optimize processes, or improve performance.
A Data Analyst’s responsibilities often include :

* Collecting data : Gathering information from various sources.

* Cleaning data : Ensuring the quality and accuracy of the data.

* Analyzing data : Identifying trends, patterns, and correlations.

* Presenting data : Creating visualizations and reports to share findings.

* Making recommendations : Using data insights to help inform decisions within the organization.

Their skills typically include knowledge of data analysis tools and programming languages (like SQL, R, Python), as well as a strong understanding of statistics
Here are some key skills usually required for a data analyst :

Analytical skills : Ability to collect, organize, and dissect data to make it meaningful.

Mathematical and Statistical skills : Proficiency in applying the right statistical methods or algorithms on data to get the insights needed.

Problem-solving skills : Ability to identify issues, obstacles, and opportunities in data and come up with effective solutions.

Attention to Detail : Ensuring precision in data collection, analysis, and interpretation.

Knowledge of Machine Learning : In some roles, a basic understanding of machine learning concepts can be beneficial.


* Database knowledge
* Database management
* Data blending
* Querying
* Data manipulation

* Predictive Analytics
* Basic descriptive statistics
* Predictive modeling
* Advanced analytics

* Big Data Knowledge
* Big data analytics
* Unstructured data analysis
* Machine learning

* Presentation skill
* Data visualization
* Insight presentation
* Report design
Data Wrangling is the process wherein raw data is cleaned, structured, and enriched into a desired usable format for better decision making. It involves discovering, structuring, cleaning, enriching, validating, and analyzing data. This process can turn and map out large amounts of data extracted from various sources into a more useful format. Techniques such as merging, grouping, concatenating, joining, and sorting are used to analyze the data. Thereafter it gets ready to be used with another dataset.
As a data analyst, you are expected to know the tools mentioned below for analysis and presentation purposes.

Some of the popular tools you should know are :

* MS SQL Server, MySQL : For working with data stored in relational databases

* MS Excel, Tableau : For creating reports and dashboards

* Python, R, SPSS : For statistical analysis, data modeling, and exploratory analysis

* MS PowerPoint : For presentation, displaying the final results and important conclusions
Create a data cleaning plan by understanding where the common errors take place and keep all the communications open.

Before working with the data, identify and remove the duplicates. This will lead to an easy and effective data analysis process.

Focus on the accuracy of the data. Set cross-field validation, maintain the value types of data, and provide mandatory constraints.

Normalize the data at the entry point so that it is less chaotic. You will be able to ensure that all information is standardized, leading to fewer errors on entry.
Exploratory data analysis (EDA) helps to understand the data better.

The significance of EDA includes :

* Understanding the Data : EDA allows analysts to understand the data they are working with. By creating visualizations, calculating statistics, and exploring the data structure, analysts can begin to understand the patterns, trends, outliers, and anomalies in the data.

* Guiding Future Analysis : EDA can help analysts decide which types of models or algorithms would be most appropriate to apply, and what data cleaning or transformation might be necessary.

* Data Cleaning : During EDA, analysts can identify errors or inconsistencies in the data that need to be corrected, and missing values that need to be addressed, before modeling can take place.

* Assumption Checking : Many statistical models and machine learning algorithms make assumptions about the data (for example, that it is normally distributed, or that its variables are scaled similarly). EDA allows these assumptions to be checked.

* Feature Selection : By exploring correlations and relationships between variables, EDA can help in selecting features for machine learning models.
 

Explain Outlier :

An outlier is a data point that significantly differs from other similar points. It’s an observation that lies an abnormal distance from other values in a random sample from a population. In other words, an outlier is very much different from the “usual” data.

Depending on the context, outliers can have a significant impact on your data analysis. In statistical analysis, outliers can distort the interpretation of the data by skewing averages and inflating the standard deviation.

Descriptive

Predictive

Prescriptive

It provides insights into the past to answer “what has happened”

Understands the future to answer “what could happen”

Suggest various courses of action to answer “what should you do”

Uses data aggregation and data mining techniques

Uses statistical models and forecasting techniques

Uses simulation algorithms and optimization techniques to advise possible outcomes

Example : An ice cream company can analyze how much ice cream was sold, which flavors were sold, and whether more or less ice cream was sold than the day before

Example : An ice cream company can analyze how much ice cream was sold, which flavors were sold, and whether more or less ice cream was sold than the day before

Example : Lower prices to increase the sale of ice creams, produce more/fewer quantities of a specific flavor of ice cream

While analyzing data, a Data Analyst can encounter the following issues :  

* Duplicate entries and spelling errors. Data quality can be hampered and reduced by these errors. 
 
* The representation of data obtained from multiple sources may differ. It may cause a delay in the analysis process if the collected data are combined after being cleaned and organized.  

* Another major challenge in data analysis is incomplete data. This would invariably lead to errors or faulty results.   

* You would have to spend a lot of time cleaning the data if you are extracting data from a poor source.   

* Business stakeholders' unrealistic timelines and expectations   

* Data blending/ integration from multiple sources is a challenge, particularly if there are no consistent parameters and conventions   

* Insufficient data architecture and tools to achieve the analytics goals on time.
Data mining Process : It generally involves analyzing data to find relations that were not previously discovered. In this case, the emphasis is on finding unusual records, detecting dependencies, and analyzing clusters. It also involves analyzing large datasets to determine trends and patterns in them.  

Data Profiling Process : It generally involves analyzing that data's individual attributes. In this case, the emphasis is on providing useful information on data attributes such as data type, frequency, etc. Additionally, it also facilitates the discovery and evaluation of enterprise metadata.
Data Mining Data Profiling
It involves analyzing a pre-built database to identify patterns. It involves analyses of raw data from existing datasets. 
It also analyzes existing databases and large datasets to convert raw data into useful information. In this, statistical or informative summaries of the data are collected.
It usually involves finding hidden patterns and seeking out new, useful, and non-trivial data to generate useful information.  It usually involves the evaluation of data sets to ensure consistency, uniqueness, and logic.
Data mining is incapable of identifying inaccurate or incorrect data values. In data profiling, erroneous data is identified during the initial stage of analysis.
Classification, regression, clustering, summarization, estimation, and description are some primary data mining tasks that are needed to be performed.  This process involves using discoveries and analytical methods to gather statistics or summaries about the data. 
12 .
What are the ways to detect outliers? Explain different ways to deal with it.
Outliers are detected using two methods :

Box Plot Method : According to this method, the value is considered an outlier if it exceeds or falls below 1.5*IQR (interquartile range), that is, if it lies above the top quartile (Q3) or below the bottom quartile (Q1).

Standard Deviation Method : According to this method, an outlier is defined as a value that is greater or lower than the mean ± (3*standard deviation).
13 .
What Is Collaborative Filtering?
Collaborative filtering is a kind of recommendation system that uses behavioral data from groups to make recommendations. It is based on the assumption that groups of users who behaved a certain way in the past, like rating a certain movie 5 stars, will continue to behave the same way in the future. This knowledge is used by the system to recommend the same items to those groups.
14 .
What Is the Difference Between Time Series Analysis and Time Series Forecasting?
Time series analysis simply studies data points collected over a period of time looking for insights that can be unearthed from it. Time series forecasting, on the other hand, involves making predictions informed by data studied over a period of time.
Univariate analysis is when there is only one variable. This is the simplest form of analysis like trends, you can’t perform causal or relationship analysis this way. For example, growth in the population of a specific city in the last 50 years.

Bivariate analysis is when there are two variables. You can perform causal and relationship analysis. This could be the gender-wise analysis of growth in the population of a specific city.

Multivariate analysis is when there are three or more variables. Here you analyze patterns in multidimensional data, by considering several variables at a time. This could be the break up of population growth in a specific city based on gender, income, employment type, etc.
16 .
What Is a Pivot Table?
A pivot table is a data analysis tool that sources groups from larger datasets and puts those grouped values in a tabular form for easier analysis. The purpose is to make it easier to find figures or trends in the data by applying a particular aggregation function to the values that have been grouped together.
17 .
What Is Logistic Regression?
Logistic regression is a form of predictive analysis that is used in cases where the dependent variable is dichotomous in nature. When you apply logistic regression, it describes the relationship between a dependent variable and other independent variables.
18 .
What Is Linear Regression?
Linear regression is a statistical method used to find out how two variables are related to each other. One of the variables is the dependent variable and the other one is the explanatory variable. The process used to establish this relationship involves fitting a linear equation to the dataset.
KNN (K-Nearest Neighbors) imputation is a technique used to fill in missing values in a dataset by estimating them based on the values of neighboring data points. It is a non-parametric method that relies on similarity measures between data points.

Here's how the KNN imputation method works :

* Identify Similarity : First, you need to define a distance metric to measure the similarity between data points. Common distance metrics include Euclidean distance, Manhattan distance, or cosine similarity. Euclidean distance is often used when dealing with numerical data.

* Select K Neighbors : For each missing value, the algorithm identifies the K nearest neighbors to the data point with the missing value based on the chosen distance metric. These neighbors are the data points with the most similar features to the one with the missing value.

* Imputation : Once the K nearest neighbors are identified, the missing value is imputed (filled in) by averaging or taking the weighted average of the corresponding values of the neighbors. In the case of numerical data, this usually means taking the mean or median of the neighboring values. For categorical data, the mode (most common value) might be used.

* Repeat for All Missing Values : This process is repeated for all missing values in the dataset, with the algorithm finding the K nearest neighbors for each missing value and imputing them accordingly.

* Parameter Tuning : The choice of the value of K can impact the imputation results. A smaller K value might result in more local imputations, while a larger K value might provide a more global estimate. The optimal value of K can be determined through cross-validation or other validation techniques.

KNN imputation is a flexible and intuitive method for handling missing data, especially in datasets with complex patterns or structures. However, it can be computationally expensive, particularly for large datasets, as it requires calculating distances between all pairs of data points. Additionally, the effectiveness of KNN imputation depends on the quality of the similarity measure and the choice of K.
In the process of data validation, it is important to determine the accuracy of the information as well as the quality of the source. Datasets can be validated in many ways. Methods of data validation commonly used by Data Analysts include:   

* Field Level Validation : This method validates data as and when it is entered into the field. The errors can be corrected as you go.  

* Form Level Validation : This type of validation is performed after the user submits the form. A data entry form is checked at once, every field is validated, and highlights the errors (if present) so that the user can fix them.

* Data Saving Validation : This technique validates data when a file or database record is saved. The process is commonly employed when several data entry forms must be validated.    

* Search Criteria Validation : It effectively validates the user's search criteria in order to provide the user with accurate and related results. Its main purpose is to ensure that the search results returned by a user's query are highly relevant.
21 .
What do you mean by data visualization?
The term data visualization refers to a graphical representation of information and data. Data visualization tools enable users to easily see and understand trends, outliers, and patterns in data through the use of visual elements like charts, graphs, and maps. Data can be viewed and analyzed in a smarter way, and it can be converted into diagrams and charts with the use of this technology.
22 .
How does data visualization help you?
Data visualization has grown rapidly in popularity due to its ease of viewing and understanding complex data in the form of charts and graphs. In addition to providing data in a format that is easier to understand, it highlights trends and outliers. The best visualizations illuminate meaningful information while removing noise from data.
Regression substitution is a method used to impute missing values in a dataset by predicting them from other variables using a regression model. It involves fitting a regression model to the observed data and then using this model to estimate the missing values based on the values of other variables.

Here's how the regression substitution method works :

* Identify Predictor Variables : First, you need to select predictor variables that are strongly correlated with the variable containing missing values. These predictor variables should ideally be available for all data points in the dataset.

* Fit Regression Model : Once the predictor variables are identified, a regression model is trained using the observed data points where the variable of interest is not missing. The regression model could be linear regression, multiple regression, or any other suitable regression technique depending on the nature of the data and the relationships between variables.

* Predict Missing Values : After fitting the regression model, it is used to predict the missing values of the variable of interest based on the values of the predictor variables for the data points with missing values. The predicted values are substituted for the missing values in the dataset.

* Evaluate Model Performance : It's important to assess the performance of the regression model in predicting missing values. This can be done using various evaluation metrics such as mean squared error (MSE), R-squared, or cross-validation techniques.

* Iterate if Necessary : Depending on the results of the model evaluation, adjustments may need to be made to the regression model or the selection of predictor variables. The process may need to be repeated iteratively until satisfactory imputations are obtained.

Regression substitution can be a powerful method for imputing missing values, especially when there are strong relationships between variables in the dataset. However, it assumes that the relationship between the predictor variables and the variable with missing values is linear and may not perform well if this assumption is violated. Additionally, it may not be suitable for datasets with a large number of missing values or when the relationships between variables are complex.
Outliers can be detected in several ways, including visual methods and statistical techniques :

* Box Plots : A box plot (or box-and-whisker plot) can help you visually identify outliers. Points that are located outside the whiskers of the box plot are often considered outliers.

* Scatter Plots : These can be useful for spotting outliers in multivariate data.

* Z-Scores : Z-scores measure how many standard deviations a data point is from the mean. A common rule of thumb is that a data point is considered an outlier if its z-score is greater than 3 or less than -3.

* IQR Method : The interquartile range (IQR) method identifies as outliers any points that fall below the first quartile minus 1.5 times the IQR or above the third quartile plus 1.5 times the IQR.

* DBSCAN Clustering : Density-Based Spatial Clustering of Applications with Noise (DBSCAN) is a density-based clustering algorithm, which can be used to detect outliers in the data.

Explain a hash table :

A hash table, also known as a hash map, is a data structure that implements an associative array abstract data type, a structure that can map keys to values. Hash tables use a hash function to compute an index into an array of buckets or slots, from which the desired value can be found.

Hash tables are widely used because they are efficient. In a well-dimensioned hash table, the average cost (in terms of time complexity) for each lookup is independent of the number of elements stored in the table. Many programming languages have built-in support for hash tables, including Python (dictionaries), JavaScript (objects), and Java (HashMap).
A collision in a hash table occurs when two different keys hash to the same index in the array. This situation arises because the number of possible keys typically greatly exceeds the number of indices available in the array. Even with a very good hash function, it’s impossible to avoid collisions entirely.

1. Chaining (Separate Chaining) : This method involves creating a linked list for each index of the array. When multiple keys map to the same index, their key-value pairs are stored as nodes on a linked list. When we want to look up a value, we’ll have to traverse the linked list—which is a relatively quick operation if the list is short.

2. Open Addressing (Closed Hashing) : In this method, if a collision occurs, we look for another open slot in the array instead of storing multiple items in the same slot. Several probing methods can be used to find the next open slot, including linear probing (looking at the next slot in the array), quadratic probing (looking at the next square’s slot), or double hashing (using a second hash function to determine the step size).


Write characteristics of a good data model.

Here are some characteristics of a good data model :

Simplicity : A good data model should be simple and easy to interpret. It should have a logical, clear structure that can be easily understood by both the developers and the end-users.

Robustness : A robust data model can handle a variety of data types and volumes. It should be able to support new business requirements and changes without necessitating major modifications.

Scalability : The model should be designed in a way that it can efficiently handle increases in data volume and user load. It should be able to accommodate growth over time.

Consistency : Consistency in a data model refers to the need for the model to be free from contradiction and ambiguity. This ensures that the same piece of data does not have multiple interpretations.

Flexibility : A good data model can adapt to changes in requirements. It should allow for easy modifications in structure when business requirements change.
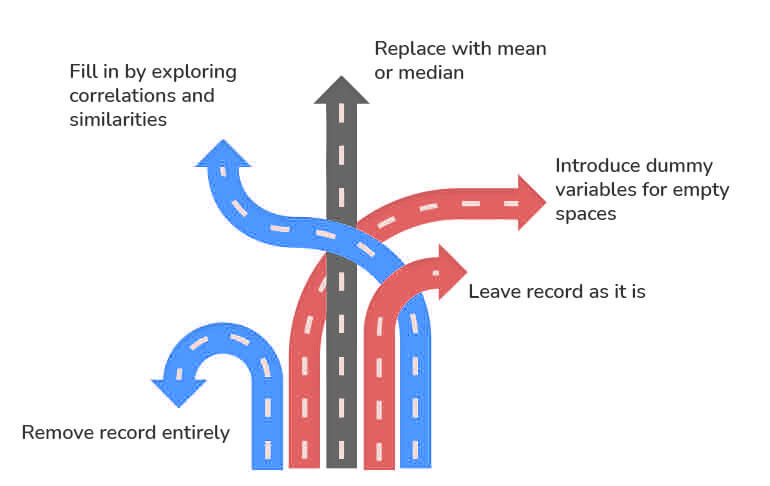
Data Cleansing or Wrangling or Data Cleaning. All mean the same thing. It is the process of identifying and removing errors to enhance the quality of data. You can refer to the below image to know the various ways to deal with missing data.
Data Cleaning
27 .
How Do You Tackle Missing Data in a Dataset?
There are two main ways to deal with missing data in data analysis.

Imputation is a technique of creating an informed guess about what the missing data point could be. It is used when the amount of missing data is low and there appears to be natural variation within the available data.

The other option is to remove the data. This is usually done if data is missing at random and there is no way to make reasonable conclusions about what those missing values might be.
28 .
What Is an N-Gram?
An n-gram is a method used to identify the next item in a sequence, usually words or speech. N-grams uses a probabilistic model that accepts contiguous sequences of items as input. These items can be syllables, words, phonemes, and so on. It then uses that input to predict future items in the sequence.
29 .
What is a null hypothesis?
Null hypotheses are one example of a statistical hypothesis. They indicate that there is no statistical significance between the two variable types. It suggests that any difference is due to chance.
30 .
What is an alternative hypothesis?
Alternative hypotheses are another type of statistical hypothesis. They suggest a statistical significance to the observations and oppose the null hypothesis.

Whereas the null hypothesis assumes no relationship between two variables, the alternative hypothesis is an assumption that data analysts use when trying to disprove a null hypothesis.
31 .
When do you think you should retrain a model? Is it dependent on the data?
Business data keeps changing on a day-to-day basis, but the format doesn’t change. As and when a business operation enters a new market, sees a sudden rise of opposition or sees its own position rising or falling, it is recommended to retrain the model. So, as and when the business dynamics change, it is recommended to retrain the model with the changing behaviors of customers.
Univariate analysis is the simplest and easiest form of data analysis where the data being analyzed contains only one variable.

Example : Studying the heights of players in the NBA.

Univariate analysis can be described using Central Tendency, Dispersion, Quartiles, Bar charts, Histograms, Pie charts, and Frequency distribution tables.


The bivariate analysis involves the analysis of two variables to find causes, relationships, and correlations between the variables.

Example : Analyzing the sale of ice creams based on the temperature outside.

The bivariate analysis can be explained using Correlation coefficients, Linear regression, Logistic regression, Scatter plots, and Box plots.


The multivariate analysis involves the analysis of three or more variables to understand the relationship of each variable with the other variables.

Example : Analysing Revenue based on expenditure.

Multivariate analysis can be performed using Multiple regression, Factor analysis, Classification & regression trees, Cluster analysis, Principal component analysis, Dual-axis charts, etc.
I can discuss the general strengths and potential limitations of data analysts :

Strengths :

* Analytical Skills : Data analysts excel at analyzing and interpreting complex data sets to uncover insights and trends.
* Technical Proficiency : They are proficient in various analytical tools and programming languages such as Python, R, SQL, and statistical software.
* Problem-Solving : Data analysts are adept at identifying and solving business problems using data-driven approaches.
* Communication : They have strong communication skills to present findings, insights, and recommendations to stakeholders effectively.
* Domain Knowledge : Data analysts often have expertise in specific industries or domains, allowing them to contextualize their analysis and provide relevant insights.


Weaknesses (Challenges) :

* Data Quality Issues : Poor data quality, including missing values, outliers, and inaccuracies, can pose challenges for data analysis and interpretation.
* Bias in Analysis : Data analysts need to be mindful of bias in data collection, analysis, and interpretation, which can skew results and recommendations.
* Scope Creep : Data analysis projects may face scope creep, where the requirements expand beyond the initial scope, leading to delays or inefficiencies.
* Interpretation Complexity : Communicating complex analysis results to non-technical stakeholders can be challenging, requiring clear and concise explanations.
* Overlooking Context : Data analysts may overlook the broader context or business implications of their analysis, focusing solely on technical aspects.
The K-means algorithm is a popular unsupervised machine learning technique used for clustering data into groups or clusters based on similarities in the feature space. It aims to partition the data into K clusters where each data point belongs to the cluster with the nearest mean, serving as the prototype of the cluster.

Here's how the K-means algorithm works :

* Initialization : The algorithm begins by randomly initializing K cluster centroids in the feature space. These centroids represent the initial guess for the centers of the clusters.

* Assignment Step : In this step, each data point is assigned to the nearest centroid based on a distance metric, typically Euclidean distance. The data points are then grouped into K clusters based on their assignments to centroids.

* Update Step : After assigning data points to clusters, the centroids of the clusters are recalculated as the mean of all data points assigned to each cluster. These recalculated centroids become the new centroids for the next iteration.

* Iteration : Steps 2 and 3 are repeated iteratively until convergence, which occurs when the centroids no longer change significantly between iterations or when a maximum number of iterations is reached.

* Convergence : Once the algorithm converges, each data point is assigned to the cluster with the nearest centroid, and the final cluster centroids represent the centers of the clusters.

The K-means algorithm aims to minimize the within-cluster sum of squared distances, also known as inertia or distortion. It does this by iteratively optimizing the cluster centroids to minimize the distance between data points and their assigned centroids.

Key considerations and limitations of the K-means algorithm include :

* The algorithm is sensitive to the initial placement of centroids, which can affect the final clustering results. Different initializations may lead to different clustering outcomes.
* K-means assumes clusters of approximately equal size and density, spherical shapes, and similar variance within clusters. It may not perform well on non-linear or irregularly shaped clusters.
* The choice of the number of clusters (K) is critical and often requires domain knowledge or heuristic approaches such as the elbow method or silhouette analysis.
* K-means is computationally efficient and scalable to large datasets but may struggle with high-dimensional data or data with varying cluster densities.
KPI : It stands for Key Performance Indicator, it is a metric that consists of any combination of spreadsheets, reports or charts about business process

Design of experiments : It is the initial process used to split your data, sample and set up of a data for statistical analysis

80/20 rules : It means that 80 percent of your income comes from 20 percent of your clients
36 .
Explain what is correlogram analysis?
A correlogram analysis is the common form of spatial analysis in geography. It consists of a series of estimated autocorrelation coefficients calculated for a different spatial relationship.  It can be used to construct a correlogram for distance-based data, when the raw data is expressed as distance rather than values at individual points.
A hash table collision happens when two different keys hash to the same value.  Two data cannot be stored in the same slot in array.

To avoid hash table collision there are many techniques, here we list out two

Separate Chaining :
It uses the data structure to store multiple items that hash to the same slot.

Open addressing :
It searches for other slots using a second function and store item in first empty slot that is found
During imputation we replace missing data with substituted values.  The two types of imputation techniques involve are

Single Imputation :

* Hot-deck imputation : A missing value is imputed from a randomly selected similar record by the help of punch card
* Cold deck imputation : It works same as hot deck imputation, but it is more advanced and selects donors from another datasets
* Mean imputation : It involves replacing missing value with the mean of that variable for all other cases
* Regression imputation : It involves replacing missing value with the predicted values of a variable based on other variables
* Stochastic regression : It is same as regression imputation, but it adds the average regression variance to regression imputation


Multiple Imputation :
* Unlike single imputation, multiple imputation estimates the values multiple times
I can offer some hypothetical reasons why someone might want to work for a specific organization as a data analytics professional :

* Alignment with Mission and Values : The organization's mission and values resonate with my own beliefs and principles, making it an ideal place to contribute meaningfully.

* Opportunity for Impact : I see the potential to make a significant impact within the organization through data analytics, whether it's optimizing processes, improving decision-making, or driving innovation.

* Learning and Growth : The organization offers opportunities for continuous learning and professional development in the field of data analytics, allowing me to enhance my skills and expertise.

* Collaborative Environment : I value collaboration and teamwork, and I'm attracted to the organization's culture of collaboration, where ideas are shared, and diverse perspectives are welcomed.

* Resources and Support : The organization provides access to state-of-the-art tools, technology, and resources necessary for conducting impactful data analysis, enabling me to perform at my best.

* Commitment to Diversity and Inclusion : I appreciate the organization's commitment to diversity and inclusion, creating an environment where individuals from all backgrounds feel valued and respected.

* Career Growth Opportunities : I see the potential for long-term career growth and advancement within the organization, with opportunities to take on challenging projects and assume leadership roles.

* Positive Reputation : The organization has a positive reputation in the industry, known for its innovation, integrity, and commitment to excellence, making it an attractive place to build a career.

* Impactful Projects : The organization is involved in meaningful and impactful projects that align with my interests and career goals, offering opportunities to work on cutting-edge initiatives.

* Work-Life Balance : The organization values work-life balance and promotes employee well-being, fostering a supportive and healthy work environment where employees can thrive both personally and professionally.

These are just some potential reasons why someone might want to work for a particular organization as a data analytics professional. It ultimately depends on individual preferences, career aspirations, and how well the organization aligns with their values and goals.
40 .
What are the scenarios that could cause a model to be retrained?
Data is never a stagnant entity. If there is an expansion of business, this could cause sudden opportunities that call for a change in the data. Furthermore, assessing the model to check its standing can help the analyst analyze whether the model is to be retrained or not.

However, the general rule of thumb is to ensure that the models are retrained when there is a change in the business protocols and offerings.
Many statistical techniques are very useful when performing data analysis.

Here are some of the important ones :

* Markov process
* Cluster analysis
* Imputation techniques
* Bayesian methodologies
* Rank statistics
There are many types of hypothesis testing. Some of them are as follows:

* Analysis of variance (ANOVA) : Here, the analysis is conducted between the mean values of multiple groups.

* T-test : This form of testing is used when the standard deviation is not known, and the sample size is relatively small.

* Chi-square Test : This kind of hypothesis testing is used when there is a requirement to find the level of association between the categorical variables in a sample.
Several Python libraries that can be used on data analysis include :

* NumPy
* Bokeh
* Matplotlib
* Pandas
* SciPy
* SciKit, etc.
COUNT function returns the count of numeric cells in a range

COUNTA function counts the non-blank cells in a range

COUNTBLANK function gives the count of blank cells in a range

COUNTIF function returns the count of values by checking a given condition
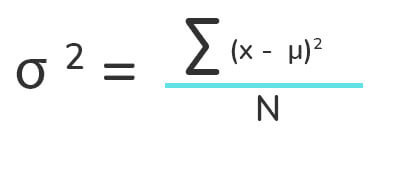
Variance : In statistics, variance is defined as the deviation of a data set from its mean value or average value. When the variances are greater, the numbers in the data set are farther from the mean. When the variances are smaller, the numbers are nearer the mean. Variance is calculated as follows:
Variance
Here, X represents an individual data point, U represents the average of multiple data points, and N represents the total number of data points.

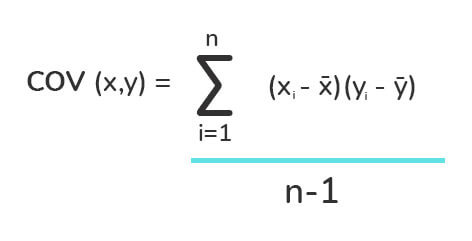
Covariance : Covariance is another common concept in statistics, like variance. In statistics, covariance is a measure of how two random variables change when compared with each other. Covariance is calculated as follows:  
Covariance
Here, X represents the independent variable, Y represents the dependent variable, x-bar represents the mean of the X, y-bar represents the mean of the Y, and N represents the total number of data points in the sample.
The storage of data is a big deal. Companies that use big data have been in the news a lot lately, as they try to maximize its potential. Data storage is usually handled by traditional databases for the layperson. For storing, managing, and analyzing big data, companies use data warehouses and data lakes.

* Data Warehouse : This is considered an ideal place to store all the data you gather from many sources. A data warehouse is a centralized repository of data where data from operational systems and other sources are stored. It is a standard tool for integrating data across the team- or department-silos in mid-and large-sized companies. It collects and manages data from varied sources to provide meaningful business insights.

Data warehouses can be of the following types :

* Enterprise data warehouse (EDW) : Provides decision support for the entire organization.

* Operational Data Store (ODS) : Has functionality such as reporting sales data or employee data.

* Data Lake : Data lakes are basically large storage device that stores raw data in their original format until they are needed. with its large amount of data, analytical performance and native integration are improved. It exploits data warehouses' biggest weakness: their incapacity to be flexible. In this, neither planning nor knowledge of data analysis is required; the analysis is assumed to happen later, on-demand.
47 .
Why is Naive Bayes called 'naive'?
Naive Bayes is called naive because it makes the general assumption that all the data present are unequivocally important and independent of each other. This is not true and won’t hold up in a real-world scenario.
48 .
What is the difference between Principal Component Analysis (PCA) and Factor Analysis (FA)?
Among many differences, the major difference between PCA and FA lies in the fact that factor analysis is used to specify and work with the variance between variables, while PCA aims to explain the covariance between the existing components or variables.

Next up on this list of top data analyst interview questions and answers, let us check out some of the top questions from the advanced category.

WHERE

HAVING

WHERE clause operates on row data. The HAVING clause operates on aggregated data.
In the WHERE clause, the filter occurs before any groupings are made.

HAVING is used to filter values from a group.

Aggregate functions cannot be used. Aggregate functions can be used.
Syntax of WHERE clause :
SELECT column1, column2, ...
FROM table_name
WHERE condition;?

Syntax of HAVING clause :
SELECT column_name(s)
FROM table_name
WHERE condition
GROUP BY column_name(s)
HAVING condition
ORDER BY column_name(s);?
A Subquery in SQL is a query within another query. It is also known as a nested query or an inner query. Subqueries are used to enhance the data to be queried by the main query.

It is of two types : Correlated and Non-Correlated Query.

Below is an example of a subquery that returns the name, email id, and phone number of an employee from Texas city.

SELECT name, email, phone

FROM employee

WHERE emp_id IN (

SELECT emp_id

FROM employee

WHERE city = 'Texas');?
51 .
What do you understand by LOD in Tableau?
LOD in Tableau stands for Level of Detail. It is an expression that is used to execute complex queries involving many dimensions at the data sourcing level. Using LOD expression, you can find duplicate values, synchronize chart axes and create bins on aggregated data.
52 .
What are the different connection types in Tableau Software?
There are mainly 2 types of connections available in Tableau.

Extract : Extract is an image of the data that will be extracted from the data source and placed into the Tableau repository. This image(snapshot) can be refreshed periodically, fully, or incrementally.

Live : The live connection makes a direct connection to the data source. The data will be fetched straight from tables. So, data is always up to date and consistent.
53 .
What are the different joins that Tableau provides?
Joins in Tableau work similarly to the SQL join statement. Below are the types of joins that Tableau supports :

* Left Outer Join
* Right Outer Join
* Full Outer Join
* Inner Join
54 .
What is a Gantt Chart in Tableau?
A Gantt chart in Tableau depicts the progress of value over the period, i.e., it shows the duration of events. It consists of bars along with the time axis. The Gantt chart is mostly used as a project management tool where each bar is a measure of a task in the project.
A Print Area in Excel is a range of cells that you designate to print whenever you print that worksheet. For example, if you just want to print the first 20 rows from the entire worksheet, then you can set the first 20 rows as the Print Area.

Now, to set the Print Area in Excel, you can follow the below steps :

* Select the cells for which you want to set the Print Area.
* Then, click on the Page Layout Tab.
* Click on Print Area.
* Click on Set Print Area.
56 .
Describe how you would use ensemble learning techniques to improve model accuracy.
Ensemble learning techniques, such as bagging, boosting, and stacking, can be used to combine multiple weak models to create a stronger model. This often results in better generalization and robustness against overfitting.
57 .
How would you deal with concept drift in a real-time data streaming application?
Concept drift can be handled by continuously monitoring model performance, setting up alerting mechanisms for performance degradation, and implementing strategies for incremental learning and model updating.
Well, there are various ways to handle slow Excel workbooks. But, here are a few ways in which you can handle workbooks.

* Try using manual calculation mode.
* Maintain all the referenced data in a single sheet.
* Often use excel tables and named ranges.
* Use Helper columns instead of array formulas.
* Try to avoid using entire rows or columns in references.
* Convert all the unused formulas to values.
A/B testing is the statistical hypothesis testing for a randomized experiment with two variables A and B. Also known as the split testing, it is an analytical method that estimates population parameters based on sample statistics. This test compares two web pages by showing two variants A and B, to a similar number of visitors, and the variant which gives better conversion rate wins.

The goal of A/B Testing is to identify if there are any changes to the web page. For example, if you have a banner ad on which you have spent an ample amount of money. Then, you can find out the return of investment i.e. the click rate through the banner ad. 
60 .
What is the statistical power of sensitivity?
The statistical power of sensitivity is used to validate the accuracy of a classifier. This classifier can be either Logistic Regression, Support Vector Machine, Random Forest etc.

If I have to define sensitivity, then sensitivity is nothing but the ratio of Predicted True Events to Total Events. Now, True Events are the events which were true and the model also predicts them as true.
Statistical Analysis System(SAS) provided by SAS Institute itself is the most popular Data Analytics tool in the market.

In simple words, SAS can process complex data and generate meaningful insights that would help organizations make better decisions or predict possible outcomes in the near future.

So, this lets you mine, alter, manage and retrieve data from different sources and analyze it.
The basic syntax style of writing code in SAS is as follows :

* Write the DATA statement which will basically name the dataset.
* Write the INPUT statement to name the variables in the data set.
* All the statements should end with a semi-colon.
* There should be a proper space between word and a statement.
What they’re really asking : What are your strengths and weaknesses?

When an interviewer asks you this type of question, they’re often looking to evaluate your strengths and weaknesses as a data analyst. How do you overcome challenges and measure the success of a data project?

Being asked about a project you’re proud of is a chance to highlight your skills and strengths. Do this by discussing your role in the project and what made it so successful. As you prepare your answer, look at the original job description to see if you can incorporate some of the skills and requirements listed.

If you get asked the negative version of a question (least successful or most challenging project), be honest as you focus your answer on lessons learned. Identify what went wrong—maybe your data was incomplete, or the sample size was too small—and talk about what you’d do differently in the future to correct the error. We’re human, and mistakes are a part of life. What’s important here is your ability to learn from them.

An interviewer might also ask :

* Walk me through your portfolio.

* What is your greatest strength as a data analyst? How about your greatest weakness?

* Tell me about a data problem that challenged you.
What they’re really asking : How are your communication skills?

While drawing insights from data is a critical skill for a data analyst, communicating those insights to stakeholders, management, and non-technical co-workers is just as important.

Your answer should include the types of audiences you’ve presented to in the past (size, background, context). If you don’t have a lot of experience presenting, you can still talk about how you’d present data findings differently depending on the audience.

An interviewer might also ask :

* What is your experience conducting presentations?

* Why are communication skills important to a data analyst?

* How do you present your findings to management?
This is your chance to slip into storytelling mode a little bit. Recruiters like when you can talk passionately about the field you’re working in and have personal reasons for why you want to work in it. Describe how you got interested in data analytics and the reasons for wanting to work in the field.

As much as possible, stay away from generic reasons for being interested in data science. Go into your own journey: how you heard about it, the resources you used to study different aspects of the field, and the work that you have done.
What they’re really asking : Have you done your research?

Before your interview, research the company, its business goals, and the larger industry. Consider the business problems that data analysis can solve and what types of data you’d need to analyze. Read up on how data is used by competitors and in the industry.

Show that you can be business-minded by tying this back to the company. How would this analysis bring value to their business?
Predicting and Preventing Traffic Congestion

Data Collection : Gather extensive real-time data from various sources, such as GPS from mobile applications, traffic cameras, IoT sensors, and social media feeds, to monitor traffic flow, weather conditions, road closures, and events.

Data Processing : Develop a robust data pipeline using technologies like Apache Kafka and Spark to clean, preprocess, and analyze data in real-time.

Predictive Modeling : Utilize machine learning models like decision trees, neural networks, or time-series forecasting models (e.g., ARIMA, LSTM) to predict congestion. Feature engineering would involve considering temporal patterns, road segments, and external factors.

Preventive Actions : Implement adaptive traffic management systems that dynamically adjust signal timings. Propose alternate routes to drivers through navigation apps and display dynamic messages on road signs.

Evaluation : Constantly evaluate and monitor the model’s predictions against actual traffic conditions to ensure accuracy and refine the model accordingly.