
p5.js is a JavaScript library for creative coding, with a focus on making coding accessible and inclusive for artists, designers, educators, beginners, and anyone else! p5.js is free and open-source because we believe software, and the tools to learn it, should be accessible to everyone.p5.js has a full set of drawing functionality using the HTML5 canvas element. You’re not limited to the drawing canvas though. You can think of your whole browser page as your sketch, including HTML5 objects for text, input, video, webcam, and sound.p5.js draws inspiration, wisdom, and guidance from its precursor Processing. However, it is a new interpretation, not an emulation or port. We don't aim to match Processing's set of functionality exactly, allowing ourselves space to deviate and grow in the context of the web.p5.js is a library of JavaScript. P5.js is running on Pure JavaScript provides some functions that make JavaScript user life easy to draw in the web.function setup() {
createCanvas(400, 400); //Canvas size 400*400
}
function draw() {
background('blue'); //background color blue
}
setup() : It is the statements in the setup() function. It executes once when the program begins. createCanvas must be the first statement.draw() : The statements in the draw() are executed until the program is stopped. Each statement is executed in sequence and after the last line is read, the first line is executed again.p5.js project is like any other web project—it utilizes HTML, CSS, and JavaScript. A typical p5.js project includes the p5.js library, index.html, style.css, and sketch.js. p5.js library must be included using a <script> tag in the <head> section of an HTML document. Only then, the p5.js library can be used in a JavaScript file.p5.js library can be any JavaScript code that extends or adds to the p5.js core functionality. There are two categories of libraries. Core libraries (p5.sound) are part of the p5.js distribution, while contributed libraries are developed, owned, and maintained by members of the p5.js community.<!DOCTYPE html>
<html lang="en">
<head>
<!-- Include p5.js library -->
<script src="p5.js"></script>
<link rel="stylesheet" type="text/css" href="style.css">
<meta charset="utf-8" />
</head>
<body>
<script src="p5.sound.js"></script>
<script src="sketch.js"></script>
</body>
</html><canvas> element is an HTML element that renders graphics created with JavaScript’s Canvas API.p5.js library provides many built-in drawing functions that simplify drawing to the HTML <canvas> on the fly using JavaScript.createCanvas() function creates an HTML canvas on the web page, taking the desired canvas width and height as arguments. Typically, it is one of the first functions called in the setup() function. The createCanvas() function can only be called once within a p5.js sketch.function setup(){
// Creates a canvas with 600px width and 400px height
createCanvas(600, 400);
}p5.js sketch does not require a canvas, explicitly call the noCanvas() function to stop the p5.js library from creating a canvas at the start of the program.function setup() {
// No canvas element will be created for this p5.js sketch
noCanvas();
}";" (semi-colon) symbol is used to end statements. It is called the "statement terminator". Comments are used for making notes to help people better understand programs. A comment begins with two forward slashes ("//").// The createCanvas function is a statement that tells the computer
// how large to make the window.
// Each function statement has zero or more parameters.
// Parameters are data passed into the function
// and are used as values for telling the computer what to do.
function setup() {
createCanvas(710, 400);
}
// The background function is a statement that tells the computer
// which color (or gray value) to make the background of the display window
function draw() {
background(204, 153, 0);
}
function setup() {
// Sets the screen to be 720 pixels wide and 400 pixels high
createCanvas(720, 400);
}
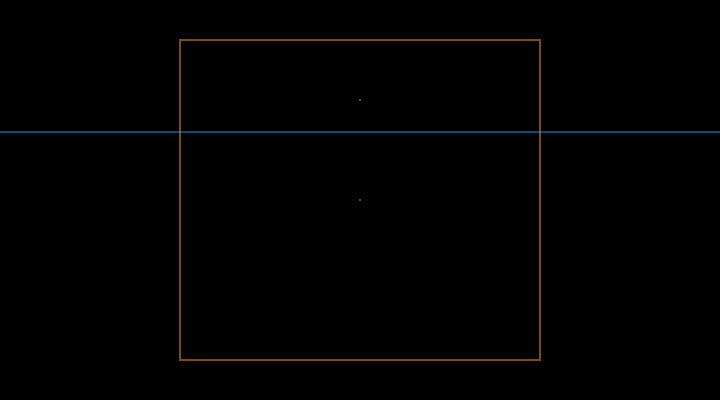
function draw() {
// Set the background to black and turn off the fill color
background(0);
noFill();
// The two parameters of the point() method each specify
// coordinates.
// The first parameter is the x-coordinate and the second is the Y
stroke(255);
point(width * 0.5, height * 0.5);
point(width * 0.5, height * 0.25);
// Coordinates are used for drawing all shapes, not just points.
// Parameters for different functions are used for different
// purposes. For example, the first two parameters to line()
// specify the coordinates of the first endpoint and the second
// two parameters specify the second endpoint
stroke(0, 153, 255);
line(0, height * 0.33, width, height * 0.33);
// By default, the first two parameters to rect() are the
// coordinates of the upper-left corner and the second pair
// is the width and height
stroke(255, 153, 0);
rect(width * 0.25, height * 0.1, width * 0.5, height * 0.8);
}background() function sets the background color of the p5.js canvas. The background of a p5.js canvas is transparent by default.function setup(){
// Sets background to a gray color
background(127);
}background() function is called with a numeric argument between 0 and 255, the background color will be set to a grayscale value, with 0 being pure black and 255 being pure white.function setup(){
// Sets the background color to white
background(255);
}p5.js library automatically executes the setup() function. The setup() function should not be explicitly called in the sketch.function setup() {
// Runs once at the beginning of the p5.js sketch
}setup() function typically contains code that defines the initial state of the sketch, such as the canvas size, background color, and initial values of global variables.let beginSize;
// Initializing the canvas size, background color and beginlSize value
function setup() {
createCanvas(800, 600);
background(220);
beginSize = 5;
}draw() function is automatically called after the setup() function, which runs once at the program’s start. The draw() loop infinitely runs the code block inside the function from top to bottom.function setup(){
// Runs once at the start of the program
}
function draw(){
// Loops infinitely after setup() is run
}p5.js canvas uses a coordinate system to describe space. The origin, (0, 0), of the canvas is the top-left corner of the canvas.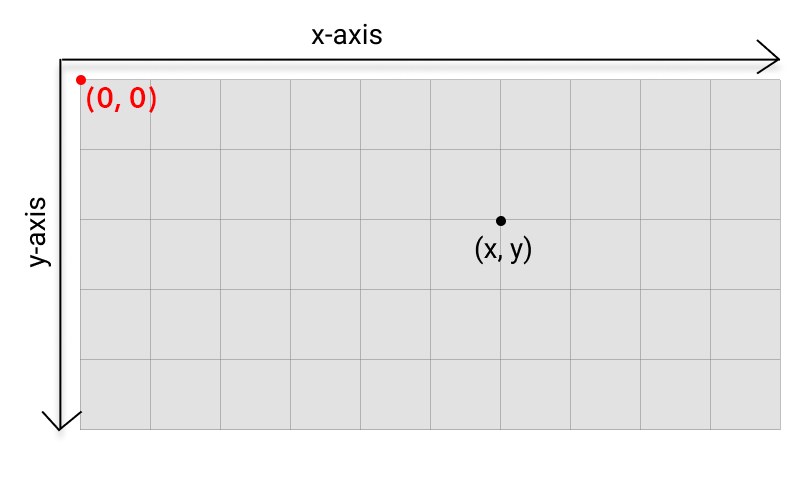
ordered pairs, (x, y), where the x coordinate is the distance from the left edge of the canvas and the y coordinate is the distance from the top edge of the canvas.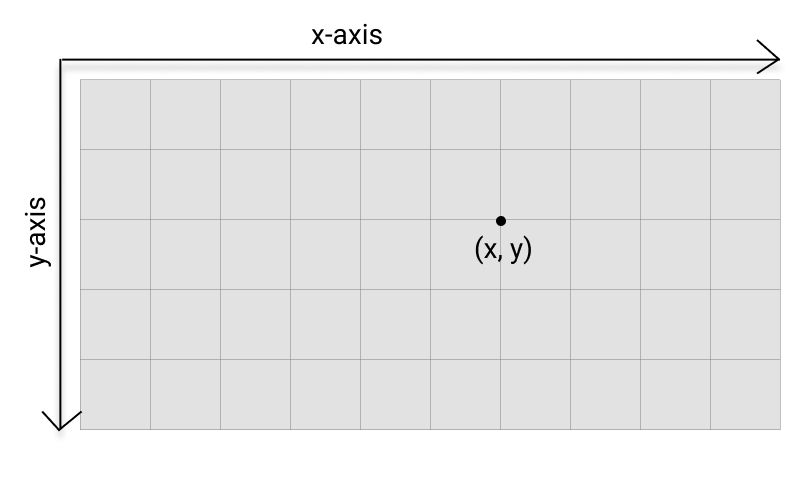
p5.js. It can be given as: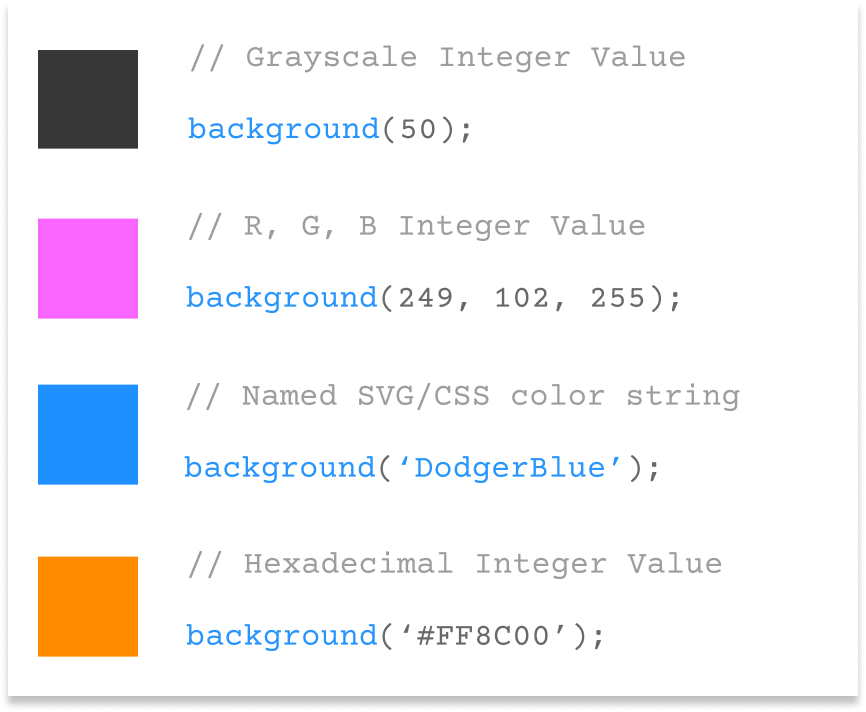
d' to scale the form. The four variables set the positions based on the value of 'd'.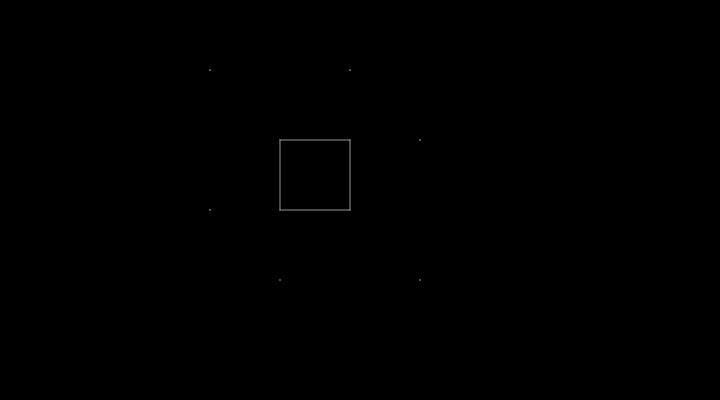
function setup() {
  let d = 70;
  let p1 = d;
  let p2 = p1 + d;
  let p3 = p2 + d;
  let p4 = p3 + d;

  // Sets the screen to be 720 pixels wide and 400 pixels high
  createCanvas(720, 400);
  background(0);
  noSmooth();

  translate(140, 0);

  // Draw gray box
  stroke(153);
  line(p3, p3, p2, p3);
  line(p2, p3, p2, p2);
  line(p2, p2, p3, p2);
  line(p3, p2, p3, p3);

  // Draw white points
  stroke(255);
  point(p1, p1);
  point(p1, p3);
  point(p2, p4);
  point(p3, p1);
  point(p4, p2);
  point(p4, p4);
}scope". For example, variables declared within either the setup() or draw() functions may be only used in these functions. Global variables, variables declared outside of setup() and draw(), may be used anywhere within the program. If a function variable is declared with the same name as a global variable, the program will use the function variable to make its calculations within the current scope.
let a = 80; // Create a global variable "a"
function setup() {
createCanvas(720, 400);
background(0);
stroke(255);
noLoop();
}
function draw() {
// Draw a line using the global variable "a"
line(a, 0, a, height);
// Use a local variable a in for loop
for (let a = 120; a < 200; a += 3) {
line(a, 0, a, height);
}
// Make a call to the custom function drawAnotherLine()
drawAnotherLine();
// Make a call to the custom function drawYetAnotherLine()
drawYetAnotherLine();
}
function drawAnotherLine() {
// Create a new variable "a" local to this function
let a = 320;
// Draw a line using the local variable "a"
line(a, 0, a, height);
}
function drawYetAnotherLine() {
// Because no new local variable "a" is set,
// this line draws using the original global
// variable "a" which is set to the value 20.
line(a + 3, 0, a + 3, height);
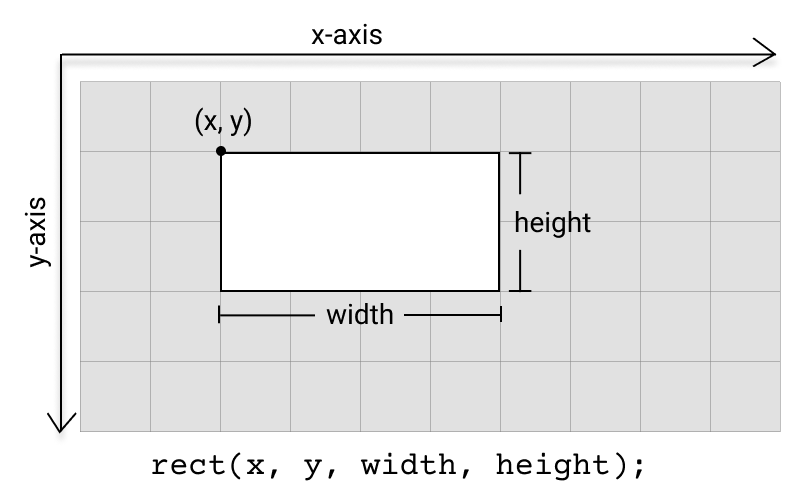
}rect() function draws a rectangle to the canvas. It takes four arguments: the first two arguments are the x and y positions of the top left corner of the rectangle. The third argument is the width, and the fourth argument is the height.
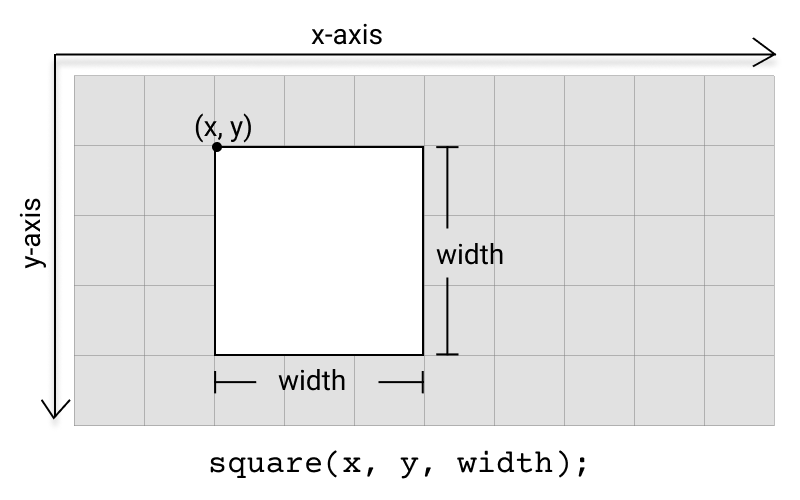
square() function draws a square to the canvas. It has three required arguments: the first two arguments are the x and y positions of the top left corner of the square. The third argument is the width (and height) of the square.
const radius = 200;
function setup() {
createCanvas(710, 400, WEBGL);
noStroke();
fill(200);
}
function draw() {
noStroke();
background(0);
const dirY = (mouseY / height - 0.5) * 4;
const dirX = (mouseX / width - 0.5) * 4;
directionalLight(204, 204, 204, dirX, dirY, 1);
translate(-1.5 * radius, 0, 0);
sphere(radius);
translate(3 * radius, 0, 0);
sphere(radius);
}
function setup() {
createCanvas(710, 400, WEBGL);
noStroke();
}
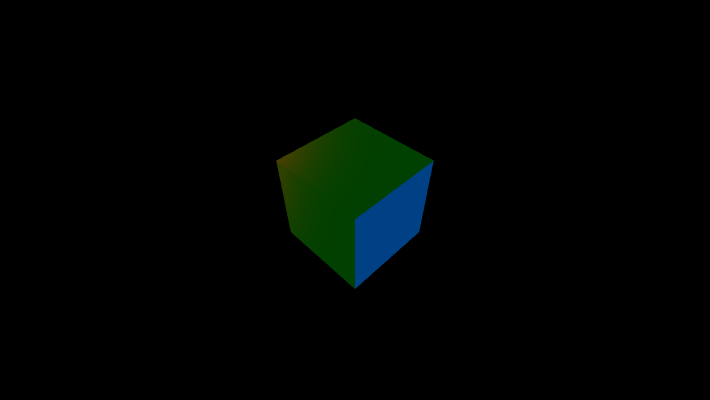
function draw() {
background(0);
// ambient light
ambientLight(0, 255/4, 0);
// to set the light position,
// think of the world's coordinate as:
// -width/2,-height/2 -------- width/2,-height/2
// | |
// | 0,0 |
// | |
// -width/2,height/2--------width/2,height/2
// blue directional light from the left
directionalLight(0, 0, 255, -1, 0, 0);
// calculate distance from center to mouseX
let lightX = mouseX - width / 2;
let lightY = mouseY - height / 2;
// red spotlight
// axis located at lightX, lightY, 500
// axis direction of light: 0, 0, -1
spotLight(255, 0, 0, lightX, lightY, 500, 0, 0, -1);
// rotate on X axis
rotateX(-PI/4);
// rotate on Y axis
rotateY(PI/4);
// place box on (0, 0, 0), size 100
box(100);
}ellipse() function draws an ellipse to the canvas. It requires four arguments where the first and second arguments are the x and y positions of the center of the ellipse. The third and fourth arguments are the width and height of the ellipse.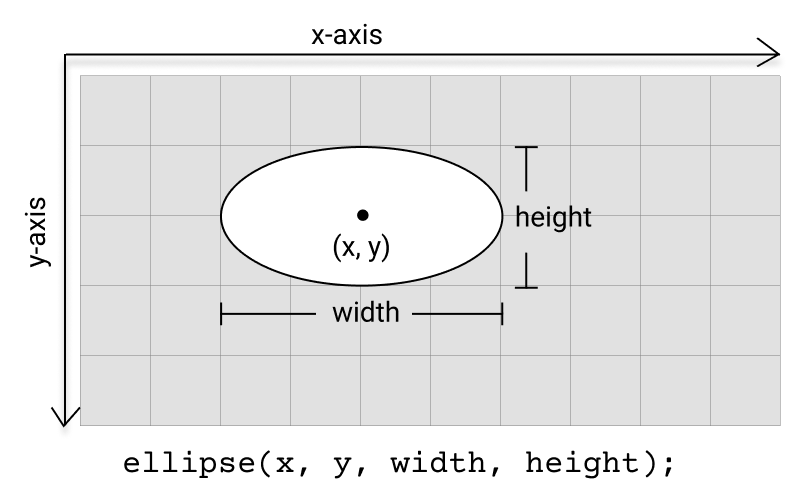
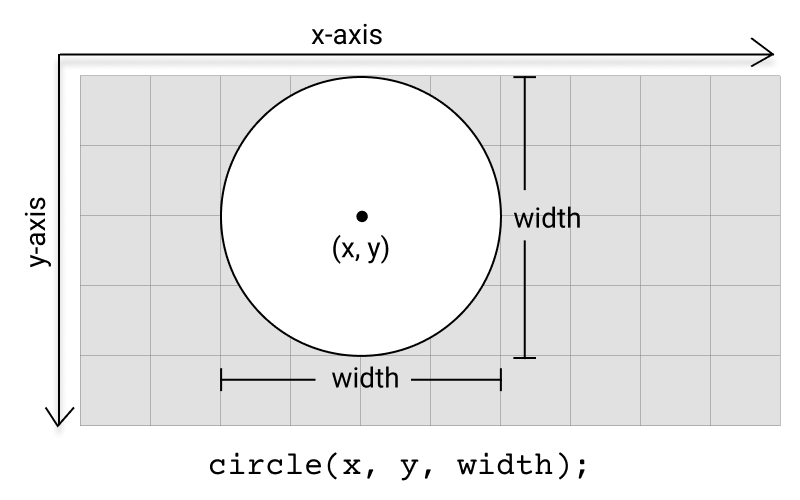
circle() function draws a circle to the canvas. It has three required arguments where the first and second arguments are the x and y positions of the center of the circle. The third argument is the width (and height) of the circle.
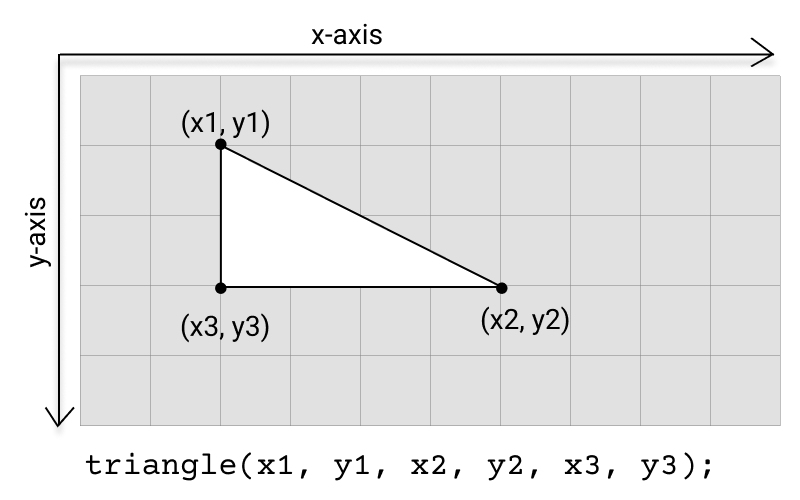
triangle() function draws a triangle to the canvas. It has six required arguments: the x and y positions for each of the triangle’s three vertices.
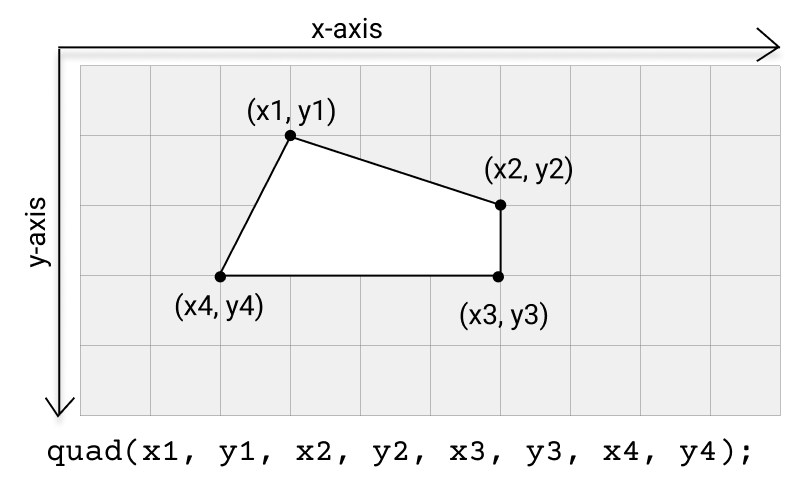
quad() function draws a quadrilateral to the canvas. It has eight required arguments: the x and y positions for each of the four vertices.
createCanvas() function.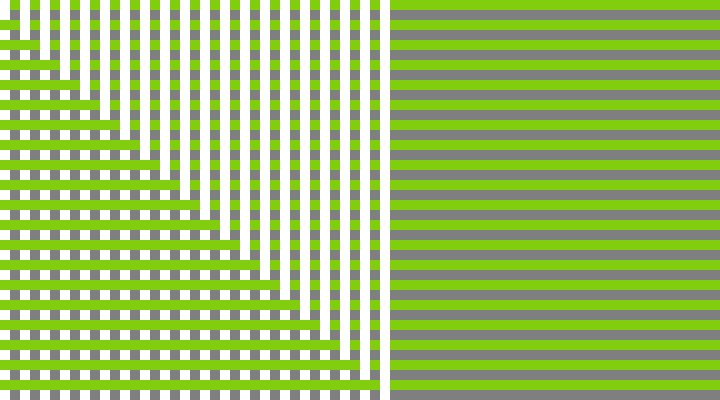
function setup() {
  createCanvas(720, 400);
}

function draw() {
  background(127);
  noStroke();
  for (let i = 0; i < height; i += 20) {
    fill(129, 206, 15);
    rect(0, i, width, 10);
    fill(255);
    rect(i, 0, 10, height);
  }
}draw() function runs continuously from top to bottom until the program is stopped. The code in setup() is run once when the program starts.let y = 100;
// The statements in the setup() function
// execute once when the program begins
function setup() {
// createCanvas must be the first statement
createCanvas(720, 400);
stroke(255); // Set line drawing color to white
frameRate(30);
}
// The statements in draw() are executed until the
// program is stopped. Each statement is executed in
// sequence and after the last line is read, the first
// line is executed again.
function draw() {
background(0); // Set the background to black
y = y - 1;
if (y < 0) {
y = height;
}
line(0, y, width, y);
}fill() function sets the color used to fill a shape with the specified color. It must be called prior to drawing the shape. The default fill color is white.function draw(){
// Sets the fill color of the circle to blue
fill(0, 0, 255);
circle(100, 100, 25);
}noFill() function sets the fill color of a shape as transparent. It must be called before drawing the shape.function draw(){
// Sets the square to have transparent fill
noFill();
square(50, 50, 25);
}stroke() function sets the stroke color used for a shape to the specified color. It must be called before drawing the shape. The default stroke color is black.function draw(){
// Sets stroke color of the square to green
stroke(0, 255, 0);
square(50, 50, 25);
}noStroke() function disables the stroke of a shape. It must be called before drawing the shape.function draw(){
// Draws a circle with blue fill color and no stroke/outline
noStroke();
fill(0, 0, 255);
circle(50, 50, 25);
}strokeWeight() function sets the width of a shape’s stroke to specified pixels. It must be called before drawing the shape. The default stroke weight is 1 pixel.function draw(){
// Draws a line of 5px thickness
strokeWeight(5);
line(50, 25, 50, 75);
}
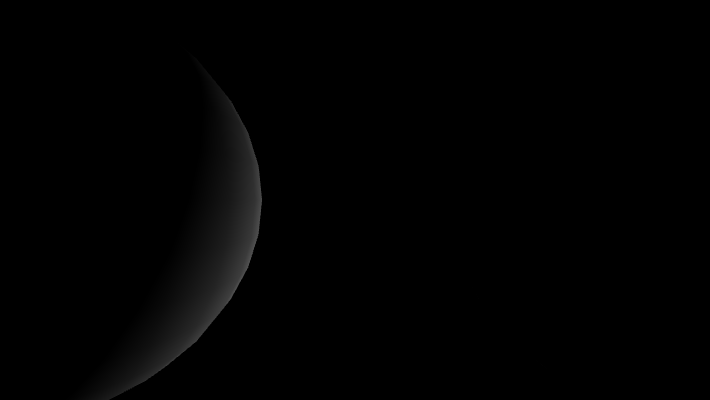
mask() method of p5.Image.let img;
let imgMask;
function preload() {
img = loadImage('assets/moonwalk.jpg');
imgMask = loadImage('assets/mask.png');
}
function setup() {
createCanvas(720, 400);
img.mask(imgMask);
imageMode(CENTER);
}
function draw() {
background(0, 102, 153);
image(img, width / 2, height / 2);
image(img, mouseX, mouseY);
}copy() method.let draft, ready;
function preload() {
ready = loadImage("assets/parrot-color.png");
draft = loadImage("assets/parrot-bw.png");
}
function setup() {
createCanvas(600, 400);
noCursor();
cursor("assets/brush.png", 20, -10);
image(ready, 0, 0);
image(draft, 0, 0);
}
function mouseDragged() {
copy(ready, mouseX, mouseY, 20, 20, mouseX, mouseY, 20, 20);
}//Position of left hand side of floor
let base1;
//Position of right hand side of floor
let base2;
//Length of floor
//let baseLength;
// Variables related to moving ball
let position;
let velocity;
let r = 6;
let speed = 3.5;
function setup() {
createCanvas(710, 400);
fill(128);
base1 = createVector(0, height - 150);
base2 = createVector(width, height);
//createGround();
//start ellipse at middle top of screen
position = createVector(width / 2, 0);
//calculate initial random velocity
velocity = p5.Vector.random2D();
velocity.mult(speed);
}
function draw() {
//draw background
fill(0, 12);
noStroke();
rect(0, 0, width, height);
//draw base
fill(200);
quad(base1.x, base1.y, base2.x, base2.y, base2.x, height, 0, height);
//calculate base top normal
let baseDelta = p5.Vector.sub(base2, base1);
baseDelta.normalize();
let normal = createVector(-baseDelta.y, baseDelta.x);
let intercept = p5.Vector.dot(base1, normal);
//draw ellipse
noStroke();
fill(255);
ellipse(position.x, position.y, r * 2, r * 2);
//move ellipse
position.add(velocity);
//normalized incidence vector
incidence = p5.Vector.mult(velocity, -1);
incidence.normalize();
// detect and handle collision with base
if (p5.Vector.dot(normal, position) > intercept) {
//calculate dot product of incident vector and base top
let dot = incidence.dot(normal);
//calculate reflection vector
//assign reflection vector to direction vector
velocity.set(
2 * normal.x * dot - incidence.x,
2 * normal.y * dot - incidence.y,
0
);
velocity.mult(speed);
// draw base top normal at collision point
stroke(255, 128, 0);
line(
position.x,
position.y,
position.x - normal.x * 100,
position.y - normal.y * 100
);
}
//}
// detect boundary collision
// right
if (position.x > width - r) {
position.x = width - r;
velocity.x *= -1;
}
// left
if (position.x < r) {
position.x = r;
velocity.x *= -1;
}
// top
if (position.y < r) {
position.y = r;
velocity.y *= -1;
//randomize base top
base1.y = random(height - 100, height);
base2.y = random(height - 100, height);
}
}let numBalls = 13;
let spring = 0.05;
let gravity = 0.03;
let friction = -0.9;
let balls = [];
function setup() {
createCanvas(720, 400);
for (let i = 0; i < numBalls; i++) {
balls[i] = new Ball(
random(width),
random(height),
random(30, 70),
i,
balls
);
}
noStroke();
fill(255, 204);
}
function draw() {
background(0);
balls.forEach(ball => {
ball.collide();
ball.move();
ball.display();
});
}
class Ball {
constructor(xin, yin, din, idin, oin) {
this.x = xin;
this.y = yin;
this.vx = 0;
this.vy = 0;
this.diameter = din;
this.id = idin;
this.others = oin;
}
collide() {
for (let i = this.id + 1; i < numBalls; i++) {
// console.log(others[i]);
let dx = this.others[i].x - this.x;
let dy = this.others[i].y - this.y;
let distance = sqrt(dx * dx + dy * dy);
let minDist = this.others[i].diameter / 2 + this.diameter / 2;
// console.log(distance);
//console.log(minDist);
if (distance < minDist) {
//console.log("2");
let angle = atan2(dy, dx);
let targetX = this.x + cos(angle) * minDist;
let targetY = this.y + sin(angle) * minDist;
let ax = (targetX - this.others[i].x) * spring;
let ay = (targetY - this.others[i].y) * spring;
this.vx -= ax;
this.vy -= ay;
this.others[i].vx += ax;
this.others[i].vy += ay;
}
}
}
move() {
this.vy += gravity;
this.x += this.vx;
this.y += this.vy;
if (this.x + this.diameter / 2 > width) {
this.x = width - this.diameter / 2;
this.vx *= friction;
} else if (this.x - this.diameter / 2 < 0) {
this.x = this.diameter / 2;
this.vx *= friction;
}
if (this.y + this.diameter / 2 > height) {
this.y = height - this.diameter / 2;
this.vy *= friction;
} else if (this.y - this.diameter / 2 < 0) {
this.y = this.diameter / 2;
this.vy *= friction;
}
}
display() {
ellipse(this.x, this.y, this.diameter, this.diameter);
}
}Move an ellipse around based on accelerationX and accelerationY values, and bounces when touch the edge of the canvas.
Open this page on a mobile device to display the sketch.
// Position Variables
let x = 0;
let y = 0;

// Speed - Velocity
let vx = 0;
let vy = 0;

// Acceleration
let ax = 0;
let ay = 0;

let vMultiplier = 0.007;
let bMultiplier = 0.6;

function setup() {
  createCanvas(displayWidth, displayHeight);
  fill(0);
}

function draw() {
  background(255);
  ballMove();
  ellipse(x, y, 30, 30);
}

function ballMove() {
  ax = accelerationX;
  ay = accelerationY;

  vx = vx + ay;
  vy = vy + ax;
  y = y + vy * vMultiplier;
  x = x + vx * vMultiplier;

  // Bounce when touch the edge of the canvas
  if (x < 0) {
    x = 0;
    vx = -vx * bMultiplier;
  }
  if (y < 0) {
    y = 0;
    vy = -vy * bMultiplier;
  }
  if (x > width - 20) {
    x = width - 20;
    vx = -vx * bMultiplier;
  }
  if (y > height - 20) {
    y = height - 20;
    vy = -vy * bMultiplier;
  }
}
let input, button, greeting;
function setup() {
// create canvas
createCanvas(710, 400);
input = createInput();
input.position(20, 65);
button = createButton('submit');
button.position(input.x + input.width, 65);
button.mousePressed(greet);
greeting = createElement('h2', 'what is your name?');
greeting.position(20, 5);
textAlign(CENTER);
textSize(50);
}
function greet() {
const name = input.value();
greeting.html('hello ' + name + '!');
input.value('');
for (let i = 0; i < 200; i++) {
push();
fill(random(255), 255, 255);
translate(random(width), random(height));
rotate(random(2 * PI));
text(name, 0, 0);
pop();
}
}function setup(){
createCanvas(720,400);
}
// the parameter at which x and y depends is usually taken as either t or symbol of theta
let t = 0;
function draw(){
background('#fff');
translate(width/2,height/2);
stroke('#0f0f0f');
strokeWeight(1.5);
//loop for adding 100 lines
for(let i = 0;i<100;i++){
line(x1(t+i),y1(t+i),x2(t+i)+20,y2(t+i)+20);
}
t+=0.15;
}
// function to change initial x co-ordinate of the line
function x1(t){
return sin(t/10)*125+sin(t/20)*125+sin(t/30)*125;
}
// function to change initial y co-ordinate of the line
function y1(t){
return cos(t/10)*125+cos(t/20)*125+cos(t/30)*125;
}
// function to change final x co-ordinate of the line
function x2(t){
return sin(t/15)*125+sin(t/25)*125+sin(t/35)*125;
}
// function to change final y co-ordinate of the line
function y2(t){
return cos(t/15)*125+cos(t/25)*125+cos(t/35)*125;
}