Google News
logo
Standard Deviation: Formula, Steps, and Multiple Examples
Leona Max

Publisher : Leona Max
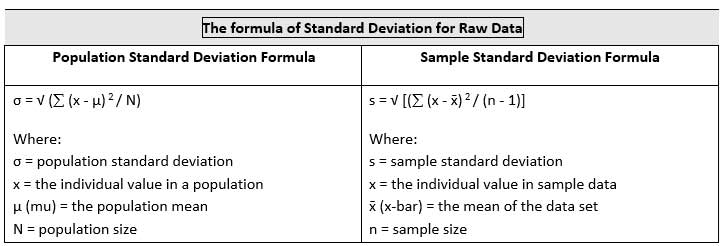

Standard Deviation: Formula, Steps, and Multiple Examples

In statistics, the standard deviation provides information about the variability within a dataset by estimating the dispersion of data points around a central tendency (often the mean). Mathematically, the standard deviation is often represented by the abbreviation “SD”.
It can also be denoted by the Greek letter sigma “σ” for the population standard deviation and the Latin letter “s” for the sample standard deviation.

In this article, we are going to learn about the standard deviation and explore its formulas. We will understand how to find the standard deviation through multiple examples.


Definition and Explanation of standard deviation :


The standard deviation is the most common method in statistics for measuring the spread or within a dataset. A larger standard deviation signifies greater variability, while a smaller one indicates that most values are closer to the mean.

The standard deviation is often used in conjunction with the mean to describe the overall characteristics of a data set. Standard deviation in mathematics refers to the square root of the average of the squared deviation of each data point from its mean value. It helps in understanding how much data points deviate from the average value.

Standard Deviation


Formula of Standard Deviation (SD) :


The formula for standard deviation is different depending on whether the data is a sample or a population as well as whether it is raw or grouped data.


The formula of Standard Deviation for Raw Data :

Raw data or ungrouped data consists of individual data points that are generally unorganized and unclassified. It can be processed into population or sample data sets for analysis based on the research question.

For raw data, the formula for standard deviation is as follows:
Standard Deviation


The Standard Deviation (SD) formula for Grouped Data :

This formula is used when the data are in the form of class intervals (0 - 5, 6 - 10, 11 - 15…). The midpoint of each class interval is used to compute the deviation. The formula of the standard deviation for grouped data is as follows:

SD = √ [ f(x – xÌ„) 2 / f]

Where :

* f signifies the frequency of class interval
* x is the midpoint that is determined by the class interval

How to Find the Standard Deviation of Raw Data?


Follow these steps to find standard deviation (SD) of raw or ungrouped data.

•    Determine the mean (average) of the data set.

Mean = Sum of the data point / Number of data points

•    Subtract the mean from each data point in the set and take the square of the result.  Also, sum up all of the squared results.

•    Divide the sum of squared deviations by the appropriate divisor. Divided by the number of values in the set for population data. (n - 1) for sample data.

•    Take the positive square root of the result.

•    The obtaining value from step 4 will be the standard deviation of the raw data.


How to Compute the Standard Deviation of Group Data?


Follow these steps to find the standard deviation of grouped data.

•    Find the midpoint (x) of each class interval by adding the upper and lower limits of each interval and dividing by 2.

•    Calculate the mean (xÌ„) for group data using the following formula:

xÌ„ = (Σ(fx)) / Σf

•    Subtract the average from the midpoint (x) of each interval. Take a square of the calculated deviation and multiply the result by the frequency of that interval.

•    Add up all the products from Step 3.

•    Divide the sum of the products by the sum of the frequencies.

•    Take the square root of the result to get the SD of group data.


Solved Examples of Calculating Standard Deviation :

Example 1 (Raw Data) : A group of students took a test and received the following scores: 85, 91, 78, 90, and 80. Find the standard deviation.

Solution :

* Step 1 : Determine the mean of the given raw data.

Sample mean or average = (85 + 91 + 78 + 90 + 80) / 5
= 84.8


* Step 2 : Subtract the mean from each value and square the result.

(85 - 84.8)² = 0.04
(91 - 84.8)² = 38.44
(78 - 84.8)² = 44.84
(90 - 84.8)² = 27.04
(80 - 84.8)² = 23.04
Sum up all of the squared results =  (x - xÌ„) 2 = 0.04 + 38.44 + 44.84 + 27.04 + 23.04 = 134.79


* Step 3 : Divide the sum of the squared deviations by n - 1 (since this is a sample).

 [(x - xÌ„) 2 / (n - 1)] = 134.79 / 4 = 33.7


* Step 4 :
Take the square root to obtain SD.
SD = √ 33.7 = 5.81

Therefore, the standard deviation of the test scores is 5.81

Example 2 (For Group Data) :
The length of 29 items is given below. Find the Standard deviation of the distribution.

Standard-Deviation

Solution :

* Step 1 : Determine the midpoint of each interval.

Standard Deviation


* Step 2 :
Calculate the mean by the following formula.

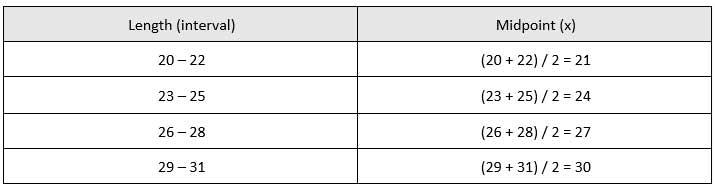
∴ xÌ„ = (Σ(fx)) / Σf
xÌ„ = [(5 × 21) + (6 × 24) + (8 × 27) + (10 × 30)] / (5 + 6 + 8 + 10)
= 765 / 29 = 26.38
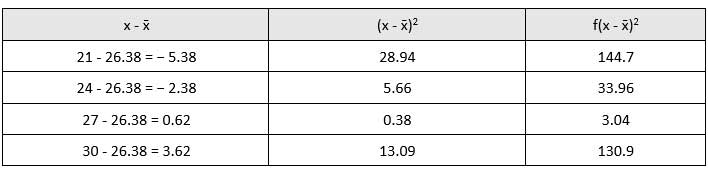

* Step 3 :
Calculate the deviation of each interval from the mean, square each deviation, and multiply by the frequency

Standard Deviation
* Step 4 : Add up the products

144.7 + 33.96 + 3.04 + 130.9 = 312.6


* Step 5 :
Divide the sum of the products by the sum of the frequencies.

= 312.6 / 29
= 10.79


* Step 5 :
Take the square root to obtain SD.

SD = √10.79 = 3.28


Conclusion :


In this article, we have explored the concept of standard deviation by defining its definition. We reviewed the formulas for standard deviation for both raw and grouped data. Furthermore, we learned how to calculate the standard deviation when data is in grouped form and when it is raw.
LATEST ARTICLES