Google News
logo
Power BI Interview Questions
Microsoft Power BI is a unified, scalable platform for self-service and enterprise Business Intelligence (BI) it provides nontechnical business users with tools for aggregating, analyzing, visualizing and sharing data.

Power BI's user interface is fairly intuitive for users familiar with Excel, and its deep integration with other Microsoft products makes it a versatile self-service tool that requires little upfront training.

Users can download an application for Windows 10 and 11, called Power BI Desktop, and native mobile apps for Windows, Android and iOS devices. There is also Power BI Report Server for companies that must maintain their data and reports on premises. That version of Power BI requires a special version of the desktop app -- aptly called Power BI Desktop for Power BI Report Server.

Power BI


Microsoft Power BI is used to find insights within an organization's data. Power BI can help connect disparate data sets, transform and clean the data into a data model and create charts or graphs to provide visuals of the data. All of this can be shared with other Power BI users within the organization.

The data models created from Power BI can be used in several ways for organizations, including the following :

* Pre-built dashboards and reports for SaaS Solutions.
* Power BI allows real-time dashboard updates.
* Offers Secure and reliable connection to your data sources in the cloud or on-premises
* Power BI offers fast deployment, hybrid configuration, and secure environment.
* Helps you in data exploration using natural language query
The primary purpose of Power BI is to scale business growth by putting information together in a more efficient way. It brings your company data forward in a seamless, comprehensive interface.

Employees and team members come forward in a streamlined fashion with access to identical information that has been translated into simplified reports, charts, diagrams, and more. Power BI Works more efficiently by improving your operational efficiency.
* Power Query (for data mash-up and transformation) : You can use this to extract data from various databases (like SQL Server, MySql, and many others ) and to delete a chunk of data from various sources.

* Power Pivot (for tabular data modeling) : It is a data modeling engine that uses a functional language called Data Analysis Expression (DAX) to perform the calculations. Also, creates a relationship between various tables to be viewed as pivot tables.

* Power View (for viewing data visualizations) : The view provides an interactive display of various data sources to extract metadata for proper data analysis.

* Power BI Desktop (a companion development tool) : Power Desktop is an aggregated tool of Power Query, Power View, and Power Pivot. Create advanced queries, models, and reports using the desktop tool.

* Power BI Mobile (for Android, iOS, Windows phones) : It gives an interactive display of the dashboards from the site onto these OS, effortlessly.

* Power Map (3D geo-spatial data visualization).

* Power Q&A (for natural language Q&A).
5 .
What are the available formats?
Power BI is available in various formats :

* Power BI desktop : For the desktop version

* Power BI mobile app : For using the visualizations on mobile OS and share it

* Power BI services : For online SaaS (Software as a Service)
Both Tableau and Power BI are the current IT industry's data analytics and visualization giants. Yet, there are a few significant differences between them. You will now explore the important differences between Tableau and Power BI.

Aspect  Tableau Power BI
Company and Licensing Developed by Microsoft Developed by Tableau Software (now part of Salesforce)
Ease of Use User-friendly with a drag-and-drop interface Steeper learning curve and requires more technical skills
Data Connectivity Native connectors to Microsoft products and various data sources Broad compatibility with databases, web services, and file formats
Visualization Interactive visualizations and dashboards with modern design Advanced visualization capabilities, complex charts and maps
Collaboration Easy sharing within Power BI service, integration with SharePoint and Teams Sharing options like Tableau Server and Tableau Online
Pricing Model Free version (Power BI Desktop), Power BI Pro, Power BI Premium Free trial (Tableau Desktop), Tableau Creator, Tableau Server
The differences between Power Query and Power Pivot are explained as follows :

Power Query Power Pivot
Power Query is all about analyzing data. Power Pivot is all about getting and Transforming data.
Power Query is an ETL service tool. Power Pivot is an in-memory data modeling component
8 .
What is a Power BI Desktop?
To access the Power BI features, visualize data, or model them to create reports, you can simply download a desktop version of Power BI. With the desktop version, you can extract data from various data sources, transform them, create visuals or reports, and share them using Power BI services.
9 .
What is Power Pivot?
Power Pivot is an add-on provided by Microsoft for Excel since 2010. Power Pivot was designed to extend the analytical capabilities and services of Microsoft Excel.
10 .
What is Power Query?
Power Query is a business intelligence tool designed by Microsoft for Excel. Power Query allows you to import data from various data sources and will enable you to clean, transform and reshape your data as per the requirements. Power Query allows you to write your query once and then run it with a simple refresh.
Primarily, Power BI has two sources to store data :

Azure Blob Storage : When users upload the data, it gets stored here.

Azure SQL Database : All the metadata and system artifacts are stored here.

They are stored as either fact tables or dimensional tables.
In power BI, you have various kinds of views viz:

* Data View : Curating, exploring, and viewing data tables in the data set. Unlike, Power Query editor, with data view, you are looking at the data after it has been fed to the model.

* Model View : This view shows you all the tables along with their complex relationships. With this, you can break these complex models into simplified diagrams or set properties for them at once.

* Report View : The report view displays the tables in an interactive format to simplify data analysis. You can create n number of reports, provide visualizations, merge them, or apply any such functionality.
Because of the following reasons :

* Data Consistency : By applying consistent formatting throughout your Power BI reports and dashboards, you ensure that the visualizations and data representation maintain a uniform appearance. Consistency helps users understand and interpret the data more easily, as they don’t have to adapt to different formatting styles in different parts of the report.

* Accessibility : Proper formatting also ensures that your Power BI reports are accessible to a broader audience, including people with visual impairments or different viewing preferences. Following accessibility guidelines can be essential for compliance requirements in some organizations.

* Improved Readability : Proper formatting enhances the readability of data. Using appropriate font sizes, colors, and styles for text and numbers makes the information more accessible and reduces the chances of misinterpretation.
* Emphasizing Key Information : Formatting can be used strategically to highlight essential data points, trends, or insights. For example, you can use bold or color to draw attention to critical KPIs or performance metrics.

* Professional Look and Feel : Applying general formatting makes your reports and dashboards look more professional and polished. This is especially important if you are sharing the reports with clients, stakeholders, or colleagues.
Bi-directional cross filtering is a feature in Power BI and other data modeling tools that allows filtering to flow in both directions between related tables in a data model.

In traditional one-directional filtering, data from one table can filter data in another table, but the reverse is not true.

However, with bi-directional cross filtering, data can flow in both directions, enabling more flexible and complex data relationships.
Four main refresh options are available in Power BI :

* Package/OneDrive refresh : This synchronizes Power BI desktop or Excel file between the Power BI service and OneDrive

* Data/Model refresh : This means scheduling the data import from all the sources based on either refresh schedule or on-demand.

* Tile refresh : Refresh the tiles’ cache on the dashboard every time the data changes.

* Visual container refresh : Update the reports’ visuals and visual container once the data changes.
The three major connectivity modes in Power BI are :

Direct Query : The method allows direct connection to the Power BI model. The data doesn’t get stored in Power BI. Interestingly, Power BI will only store the metadata of the data tables involved and not the actual data. The supported sources of data query are:

* Amazon Redshift
* Azure HDInsight Spark (Beta)
* Azure SQL Database
* Azure SQL Data Warehouse
* IBM Netezza (Beta)
* Impala (version 2.x)
* Oracle Database (version 12 and above)
* SAP Business Warehouse (Beta)
* SAP HANA
* Snowflake
* Spark (Beta) (version 0.9 and above)
* SQL Server
* Teradata Database
Live Connection : Live connection is analogous to the direct query method as it doesn’t store any data in Power BI either. But opposed to the direct query method, it is a direct connection to the analysis services model. Also, the supported data sources with live connection method are limited:

* SQL Server Analysis Services (SSAS) Tabular
* SQL Server Analysis Services (SSAS) Multi-Dimensional
* Power BI Service

Import Data (Scheduled Refresh) : By choosing this method, you upload the data into Power BI. Uploading data on Power BI means consuming the memory space of your Power BI desktop. If it is on the website, it consumes the space of the Power BI cloud machine. Even though it is the fastest method, the maximum size of the file to be uploaded cannot exceed 1 GB until and unless you have Power BI premium (then you have 50 GB at the expense).

But which model to choose when depends on your use and purpose.
The term "Filter" is self-explanatory. Filters are mathematical and logical conditions applied to data to filter out essential information in rows and columns. The following are the variety of filters available in Power BI:

* Manual filters
* Auto filters
* Include/Exclude filters
* Drill-down filters
* Cross Drill filters
* Drillthrough filters
* URL filters–transient
* Pass-Through filters
Power BI provides a wide range of familiar data sources in the “Get Data” menu :

* Files : Allows you to import data from files stored on your local machine or network. Common file types include Excel workbooks, CSV files, XML, and text files.

* Databases : Provides options to connect to various databases, such as Microsoft SQL Server, Azure SQL Database, MySQL, PostgreSQL, Oracle, and more.

* Azure : Allows you to connect to data sources in Microsoft Azure, including Azure SQL Database, Azure Blob Storage, Azure Data Lake Storage, etc.

* Online Services : Includes connectors for popular online services like SharePoint Online, Dynamics 365, Google Analytics, Salesforce, and web APIs.

* Power Platform : Connect to data from other Power Platform tools like Power Apps or Power Automate (formerly known as Microsoft Flow).

* Other : This category covers various data sources such as Web, OData Feed, Hadoop File (HDFS), SharePoint Folder, and more.
The limitations of Managed Enterprise BI led to the birth of Self-service BI. There are significant differences that separate them.

Managed Enterprise BI Self-service BI
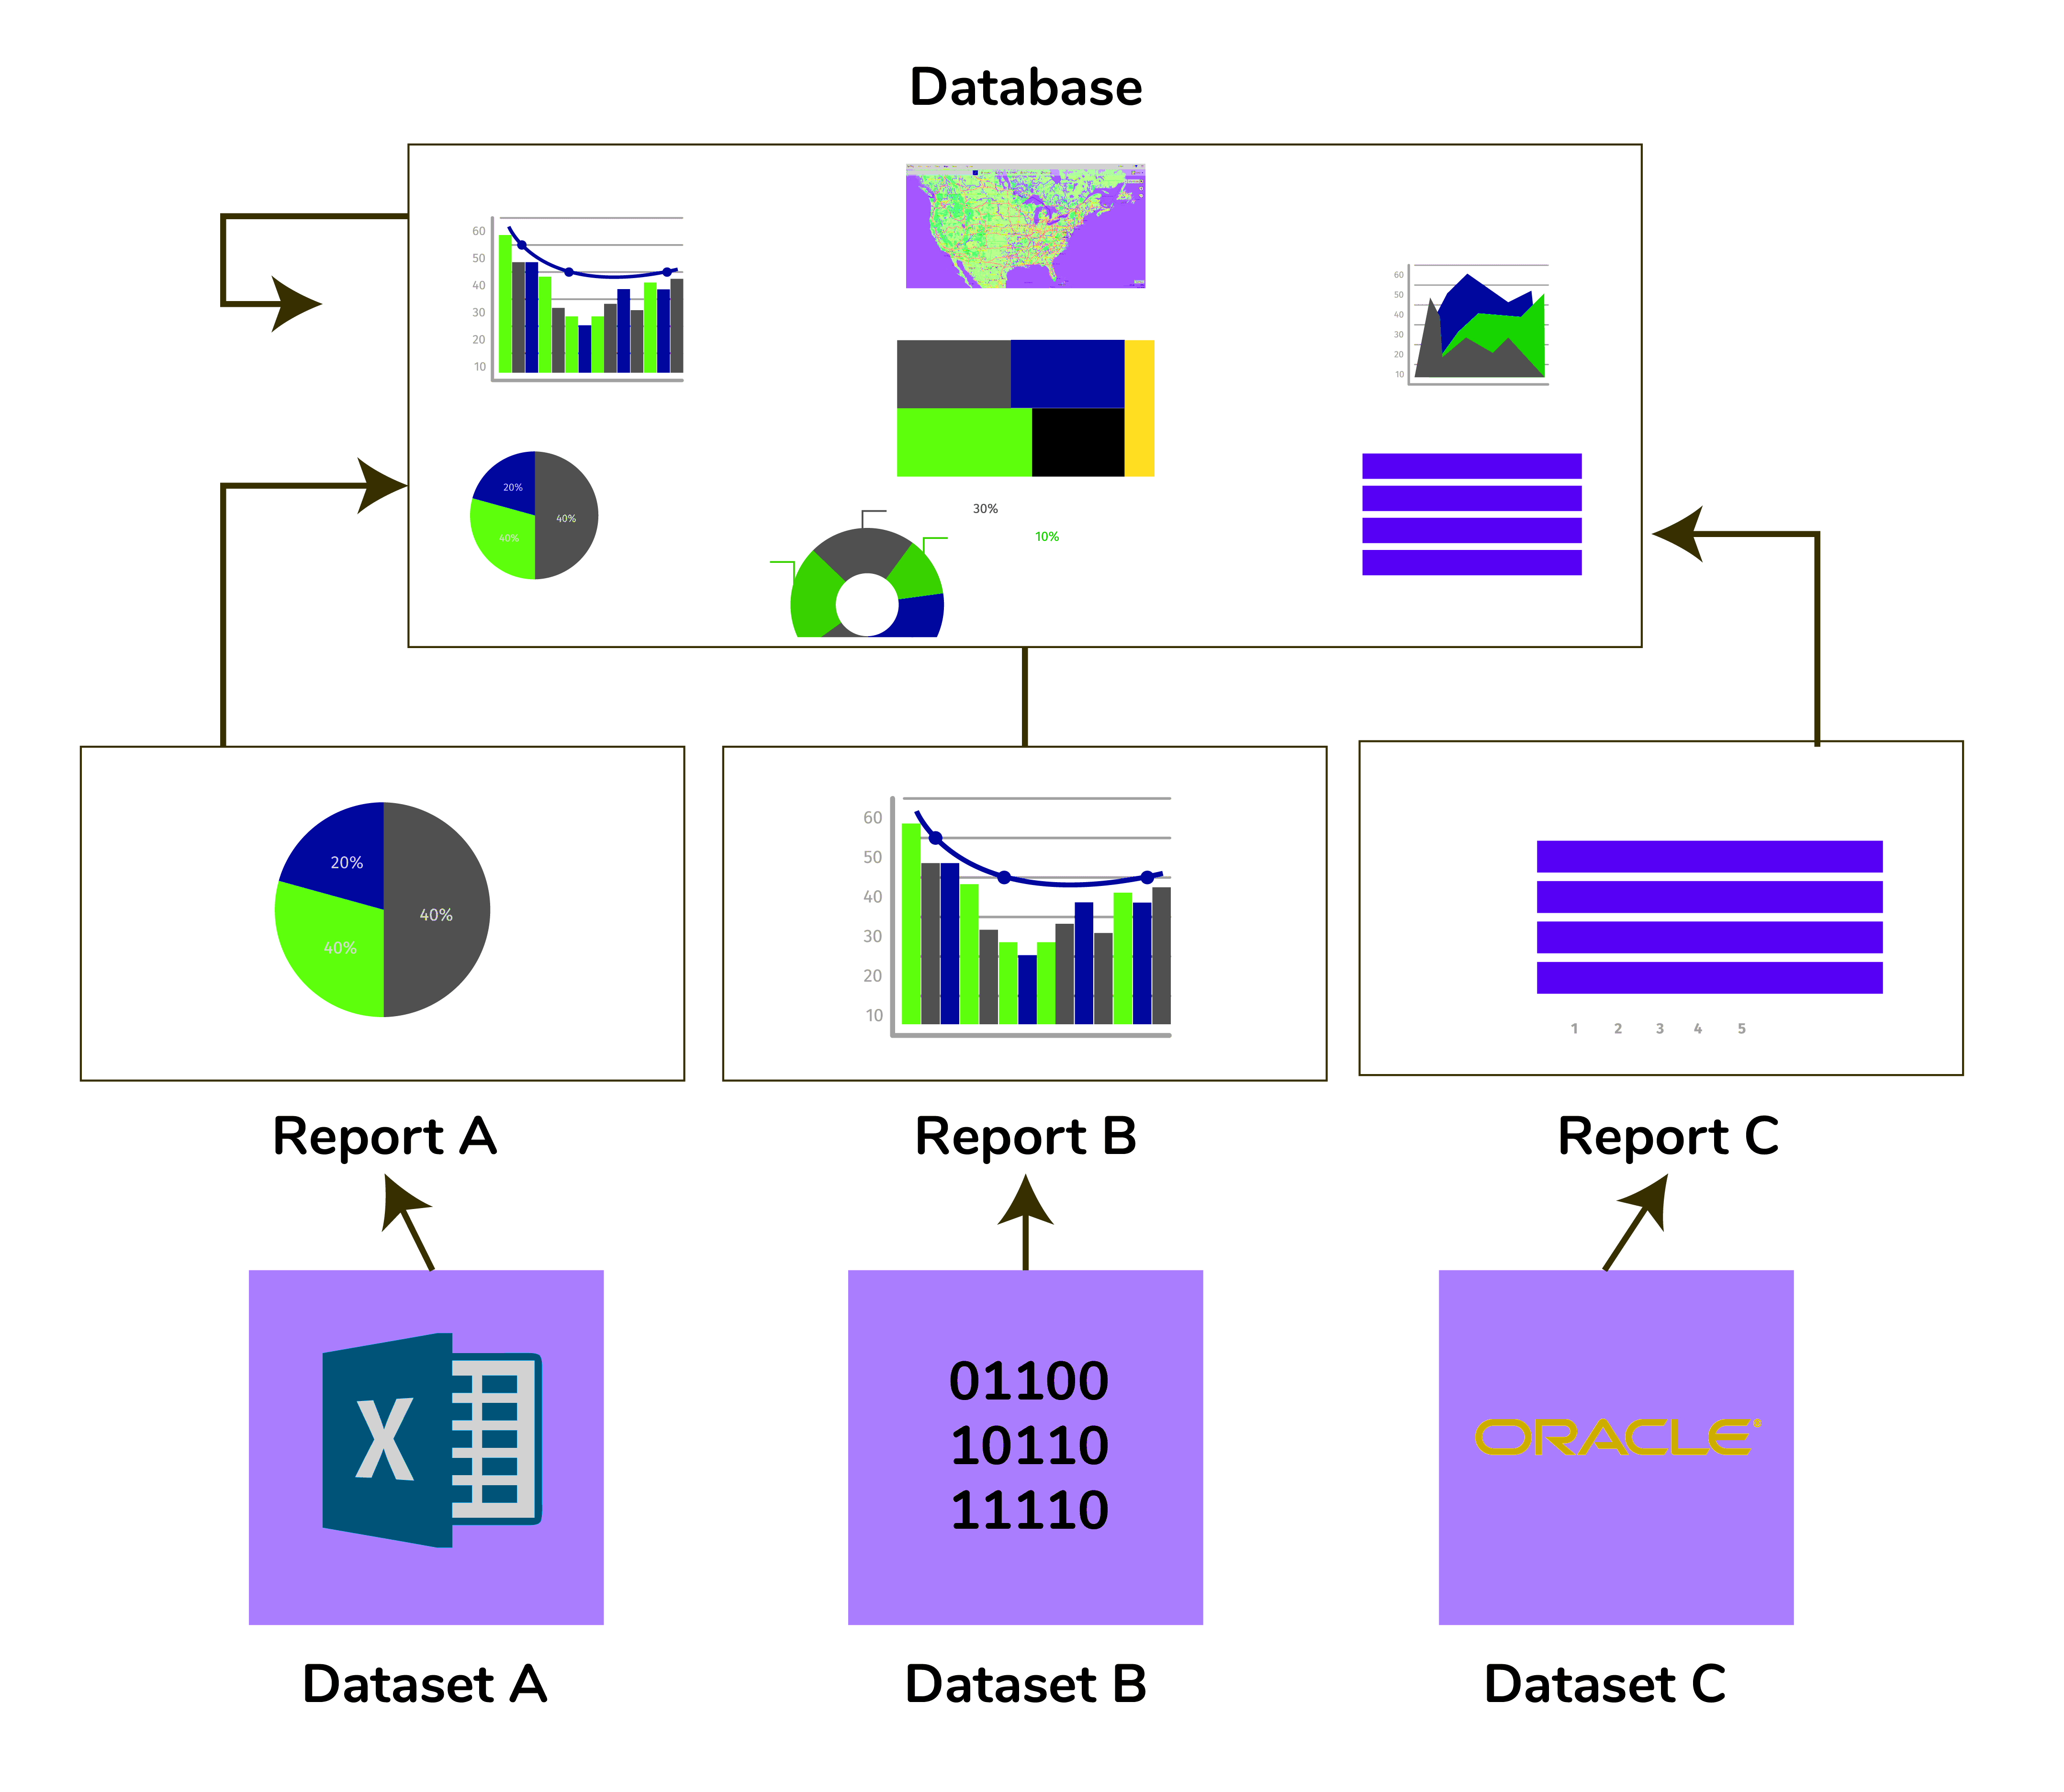
Here, data flows in from a plethora of sources and, for this reason, there is no order in which companies ingest and manage their data sources. This enables companies to ingest data from any data source, seamlessly. Companies take in data from any source in any format.
Companies fail to conduct their business operations, effectively, as they are not able to report and analyze data and collaborate for collecting valuable insights from it. With data ingestion falling into order, companies are able to process data and, consequently, conduct business operations with ease.
There are time constraints and a lack of proper information when it comes to analyzing data. Analyzing data is easy, and it is done implicitly. Time constraints are hence alleviated.
Third-party vendors are employed to help companies make the most out of their data sources, leading to budget problems and slow productivity. There is no need for third-party vendors anymore and all associated constraints are eradicated.
Complex programming skills are necessary for generating reports. Users could generate intuitive and actionable dashboards almost instantaneously without executing complex programming codes.
Self-Service Business Intelligence or SSBI is an approach to data analytics that enables business users to filter, segment, and analyze their data without the in-depth technical knowledge in statistical analysis or business intelligence (BI).

The motive of SSBI is to make data analytics easier for end-users to access their data and create various visuals to get better business insights. It is easy to use, and anybody who has a basic understanding of the data can create reports to build intuitive and shareable dashboards.
There are two parts of Microsoft Self-Service Business Intelligence Solution :

Excel BI Toolkit : Excel BI Toolkit is used to allow the users to create an interactive report by importing data from different possible sources and model data according to the report's requirement.

Power BI : The Power BI is an online solution that enables users to share the interactive reports and queries you have created using the Excel BI Toolkit.
The various Power BI components are :

* Power BI Service :

* Power BI Desktop
* Power BI Services
* Power BI Mobile
* Power BI Gateway
* Power BI Premium
* Power BI Report Server
* Power BI Embedded

* Power Pivot
* Power Query
* Power Map
* Power View
* Data Management Gateway
* Data Catalog
* Power BI Q&A


The components of Power BI are also classified as :

* Data Integration
* Data Processing
* Data Presentation
Power BI provides several options for importing data from various sources into its platform. These include:

* DirectQuery : This option allows you to create a live connection to a data source and visualize the data in real-time. No data is stored in Power BI, and all data remains in the source system.

* Import : This option allows you to import a copy of the data into Power BI and store it in the Power BI service. This option is best for small to medium-sized datasets that can be fully loaded into memory.

* Power BI Dataflows : This is a self-service ETL (extract, transform, and load) tool that allows you to connect to and cleanse data from a variety of sources, and then load the data into Power BI.

Here's a simple example of how to import data into Power BI using DirectQuery :
let dataSource = powerbi.data.createDataSource({
   type: "sql",
   connectionString: "Server=<serverName>;Database=<databaseName>;Trusted_Connection=True;",
   table: "Sales"
});

powerbi.datasets.createDataset({
   dataSource: dataSource,
   tables: [{ name: "Sales", columns: [{ name: "Product", type: "string" }, { name: "Amount", type: "decimal" }] }]
})
   .then(function (dataset) {
      let report = powerbi.report({
         data: dataset,
         type: "pie",
         options: {
            dataLabels: {
               fontSize: 20
            },
            legend: {
               visible: false
            }
         }
      });

      powerbi.render(document.getElementById("container"), report);
   });
The dashboard is like a single-page canvas on which you have various elements to create and visualize reports created by analyzing data. It comprises only the most important data from the reports to create a story.

The visual elements present on the dashboard are called Tiles. You can pin these tiles from the reports to the dashboard. Clicking any element on the dashboard takes you to the report of a particular data set.
Power BI Dashboard
Content packs are packaged reports, dashboards, and datasets, which can be shared with other Power BI users in the organization. When a content pack is connected on the Powerbi.com portal, report items are merged into workspace lists.

The two types of content packs are :

* Service provider content packs : Service providers such as Google Analytics, Salesforce, etc. provide pre-built content packages

* User-created content packs : Users can create their content packages and share them within the organization.
Parameter Power BI Excel
Tabular reports Power BI is not so handy for tabular style reports Excel is better at handling tabular-style reports.
Duplicate Table Cannot display duplicated tables  Allows to display duplicated tables
Reports Offers beautiful, personalized, and interactive reports  Doesn’t offer advanced cross-filtering between charts.
Cross filtering  Offers advanced features in cross-filtering between charts. Doesn’t offer advanced cross-filtering between charts.
Analytics Offers simple analytics Offers high-level analytics
Applications  Ideal for dashboards, KPIs, alerts, and visualizations, including analysing your data visually. Excel does have some new charts now, and they can’t connect to the data model.
27 .
Data Analysis Expression (DAX) is a library of formulas used for calculations and data analysis. This library comprises functions, constants, and operators to perform calculations and give results. DAX lets you use the data sets to their full potential and provide insightful reports.

DAX is a functional language containing conditional statements, nested functions, value references, and much more. The formulas are either numeric (integers, decimals, etc.) or non-numeric (string, binary). A DAX formula always starts with an equal sign.

DAX
A: Name of the project
B: Start of the DAX formula
C: DAX function (to add)
D: Parentheses defining arguments
E:  Name of the table
F: Name of the field
G: Operator
28 .
What are the purpose and benefits of using the DAX function?
DAX is much more than Power BI. If you learn DAX as a functional language, you become better as a data professional. DAX is based on different nested filters which magnificently improves the performance of data merging, modeling, and filtering tables.
29 .
SUM() vs SUMX(): What is the difference between the two DAX functions?
The sum function (Sum()) takes the data columns and aggregates them totally but the SumX function (SumX()) lets you filter the data which you are adding.

SUMX(Table, Expression), where the table contains the rows for calculation. Expression is a calculation that will be evaluated on each row of the table.
30 .
List the benefits of using variables in DAX.
* Improve performance
* Improve readability
* Reduce complexity
* Simplify debugging
31 .
What is the Power Map?
Power BI is a business intelligence and Analytics tool for non-technical and technical users to manage, analyze, visualize and share data with others. One of its key features is visualization - that is, presenting data and insights using appealing visuals. Among the visuals available in power BI  are maps.
32 .
How to create and use Maps in Power BI?
There are 4 types of core or built-in map visuals :

* Map (Basic)
* Filled Map
* Shape Map
* ArcGIS Maps
33 .
Explain the filled map in Power BI?
Power BI utilizes two built-in map charts map and a filled map. A filled map shows data points with geospatial areas rather than points on a map. Areas can be continent, country, state, city. Working with a filled map, however, is not as easy and convenient as the map chart is
In Power BI, data types are categorized into the following main categories:

* Text : Data types that store textual information, such as names, addresses, descriptions, etc.

Examples : Text, Whole Number (Int64), Decimal Number (Double), Currency, Percentage, etc.

* Date/Time : Data types that represent dates, times, or both.

Examples : Date, Time, Date/Time, Duration, etc.

* Boolean : Data types that store binary values (True/False).

Examples : True/False, Yes/No, On/Off, etc.

* Binary : Data types for storing binary data, typically used for images, files, or other non-textual information.

Examples : Image URL, File, etc.

* Other : Data types that do not fit into the above categories.

Examples : Blank, Any, Variant, etc.
In the context of data analysis and visualization, grouping refers to the process of combining data into logical categories based on specific criteria. By grouping data, you can organize and summarize large datasets, making it easier to understand and analyze the information.

Grouping is particularly helpful when dealing with large datasets or when you want to analyze data at a higher level of abstraction. It allows you to create more concise and focused visualizations, such as charts, tables, or pivot tables, based on the grouped data. This way, you can quickly identify trends, patterns, and comparisons within the data, making it easier to communicate insights and support decision-making.
Responsive slicers in Power BI refer to the feature that allows slicers to automatically adjust their layout and appearance based on the available space in a report or dashboard. Slicers are visual controls that provide an interactive way for users to filter data in a report. They allow users to choose specific values from a field and filter the data displayed in other visuals accordingly.

Here’s how responsive slicers work in Power BI :

Automatic Layout Adjustment : When you add slicers to a report, Power BI automatically arranges them in an optimized layout based on the available space. If the report is viewed on a smaller screen or in a narrow column, responsive slicers will adjust their size and layout accordingly to fit the space without overlapping or becoming truncated.

Collapse and Expand : When the available space is limited, responsive slicers may collapse to conserve space. This means the slicers may appear as small icons or buttons that can be expanded when clicked to reveal the full set of filter options.

Orientation Adaptation : Slicers can be oriented vertically or horizontally based on the available space. When there is more width available, slicers might be placed horizontally to display more options at once. On the other hand, when there is limited width, slicers may stack vertically to fit within the available space.

Touch-Optimized : Responsive slicers are designed to be touch-friendly, making it easier for users on touch-enabled devices like tablets or smartphones to interact with the filters.
Data can be filtered using various filters that are available in Power BI, implicitly. There are basically three types of filters, namely, Page-level filters, Drillthrough filters, and Report-level filters.

Drillthrough filters : With Drillthrough filters in Power BI Desktop, users can create a page in their reports that focuses on specific entities such as suppliers, customers, or manufacturers.

Page-level filters : These are used to filter charts that are present on individual pages.

Report-level filters : They are used to simultaneously filter charts that are present on all pages of a report.
Power BI provides better features and data manipulation tools as compared to other BI tools like Tableau. A single user can connect with multiple data sources without any experience in coding and data analytics. As a product of Microsoft, Power BI is closely integrated with other Microsoft tools such as Office 365, SharePoint, and Bing.

In the free version of Power BI Desktop, the user can analyze datasets of up to 1GB in storage along with 10,000 rows of data steaming every hour. Moreover, it provides features like Power Query which allows the user to easily visualize the datasets by giving the command in the natural English language.
Here are a few advantages of using Power BI over other applications:

ETL/Data Recovery Suite : Power BI has a robust set of tools for implementing the ETL(extraction, transformation, and loading the datasets) capabilities. Data preparation and transformation are very important before moving to the visualization part. Power BI allows the user to directly build reporting datamarts and remove any ambiguities present in the datasets.

Custom Visualization : Power BI provides you the flexibility of creating custom visualizations and adding them to your dashboards and live reports. Custom reports help the planners and decision-makers to identify the problems and make the best decision to improve their performance in the market.

Q&A Capability : Power BI is capable of executing natural language queries with the help of Power Query and Power Q&A. Power Bi use AI and Natural Language Processing(NLP) algorithms to process the commands given by the user and produce the desired results.

Easy to use : You don’t need to be an expert to visualize your data and create reports in Power BI. It has a simple interface that allows even a non-technical user to transform the raw data into visually interactive dashboards and reports.

Price : Compared to other BI and data visualization tools, Power BI is highly affordable. Small businesses can use power BI for free and take smart decisions to improvise their performance in the market. Moreover, Power BI Pro comes with an array of features for just $10 a month.
Here, are the main drawbacks of Power BI :

* Dashboards and reports only shared with users having identical email domains.

* Power Bl does not mix imported data, which is accessed from real-time connections.

* Power BI can’t accept file size larger than 1 GB.

* Dashboard does not accept or pass user, account, or other entity parameters.
Troubleshooting a report in Power BI can be a complex process, depending on the issue you're encountering. Here are some common issues and steps you can take to resolve them:

* Data connection issues : If you're having trouble connecting to your data source, check your connection string and make sure that the correct data source type is selected. You can also try refreshing your data to see if the issue is resolved.

* Data quality issues : If your data is incorrect or missing values, you can use Power Query to clean and shape your data. You can also check the data source for errors or missing values.

* Visualization issues : If your visualizations are not appearing as expected, check the fields and data types you've added to the visualization. You can also adjust the formatting options to resolve any issues.

* Performance issues : If your report is slow or unresponsive, you can optimize your data by reducing the size of your data source or using more efficient data structures. You can also adjust the visualizations to reduce the complexity of your report.


Here's an example of how to troubleshoot a data connection issue in Power BI :
let myData = [
   { year: 2020, sales: 5000 },
   { year: 2021, sales: 6000 },
   { year: 2022, sales: 7000 }
];

powerbi.connect({
   data: myData,
   type: "column",
   options: {
      dataLabels: {
         fontSize: 20
      },
      legend: {
         visible: false
      }
   },
   error: function(error) {
      console.error("Data connection error:", error);
   }
});


In this example, the error function is used to catch any errors that occur when connecting to the data source. This can help you diagnose and resolve any issues you encounter with your data connection.

Power BI Desktop is a Windows application that provides an interface for authoring and publishing reports. With Power BI Desktop, you can connect to a variety of data sources, clean and shape your data, create visualizations, and arrange and format your report. Power BI Desktop is best suited for creating reports that are designed for a specific audience and purpose, and for publishing those reports to the Power BI Service.

Power BI Service is a cloud-based service that provides a platform for sharing and collaborating on reports. With Power BI Service, you can share reports with others, collaborate on reports with others in real-time, and explore and interact with reports. Power BI Service is best suited for sharing reports with a wider audience and for exploring and interacting with reports.
Power BI is Microsoft's tool for data analysis and visualization. It doesn't require knowledge or experience of any programming language.

A data analyst can quickly connect with any data source, summarizing the findings into simple reports without any programming experience.

With Power Pivot built into the Power BI, analytics measures were developed using DAX query language from Microsoft.
44 .
Is Power BI a better option than Microsoft's Excel?
Yes. Power BI is a more powerful tool as compared to Microsoft Excel. Power BI is easy to use and is much more flexible, while Microsoft Excel is not so handy to use. Power BI is mostly used for data visualization and dashboard sharing too many users, while Microsoft Excel is mostly used for in-depth driver analysis.
45 .
What is the Embed Code in Power BI?
The Embed code is an option in the Power BI service. It is used to generate a link address for the Power BI report and can also be shared across clients.
46 .
What is the Time Intelligence function in Power BI?
In Power BI, the time intelligence function is used to manipulate data using periods.
47 .
How can you hide and unhide a specific report in Power BI?
Follow the steps given below to hide and unhide a specific report in Power BI:

* Go to the menu bar.
* Choose Selection pane.
* Select hide/unhide the report.
48 .
Explain about Bidirectional Cross-Filtering in Power BI?
One of the most important features of Power BI is  Bidirectional cross-filtering. This feature allows you to apply filters on both sides of a table relationship, using right-to-left and left-to-right options for their calculations. Through this, modelers can know how exactly particular relationships can work in multiple contexts.
In Power BI, there are several data types that can be used to define columns in a data model, including:

* Whole Number (Integer)
* Decimal Number (Floating Point)
* Currency
* Date/Time
* Text (String)
* Boolean
* Percentage

Each data type has a specific use case and can impact the results of a report. For example :


* Whole Number (Integer) - used for columns with whole numbers such as the number of units sold.

* Decimal Number (Floating Point) - used for columns with decimal values, such as sales amounts.

* Currency - used for columns with currency values, such as sales amounts.

* Date/Time - used for columns with date and time values, such as the date of a sale.

* Text (String) - used for columns with text values, such as names or product descriptions.

* Boolean - used for columns with binary values, such as true/false or yes/no.

* Percentage - used for columns with values represented as a percentage, such as the percentage of sales.

It is important to correctly define the data type for each column in the data model to ensure that the results of a report are accurate and meaningful. For example, if a column with sales amounts is defined as a Whole Number, any fractional values would be rounded or truncated, which could impact the accuracy of the results.
“M language” is a scripting language used in Power Query, a data transformation and data preparation tool that is part of Microsoft Power BI, Excel, and other Microsoft products. The M language is specifically designed for data connectivity, data transformation, and data mashup.

In Power Query, you use the M language to define the steps and operations that transform raw data from various sources into a clean, structured, and usable format for analysis. The M language provides a wide range of functions and capabilities to handle data manipulation tasks such as filtering, merging, grouping, pivoting, and more.
* Filtering : Removing unwanted rows or columns from the dataset based on specific criteria. Filtering allows you to focus on relevant data and remove noise.

* Sorting : Arranging data in a specified order based on one or more columns, typically in ascending or descending order.

* Grouping and Aggregation : Grouping data based on one or more attributes and then calculating summary statistics for each group. Common aggregations include sum, count, average, minimum, and maximum.

* Joining and Merging : Combining data from multiple tables or data sources based on common columns to create a unified dataset. Joins can be inner, left, right, or full, depending on how you want to handle unmatched rows.

* Pivoting and Unpivoting : Pivoting converts data from a “long” format (multiple rows for each attribute) to a “wide” format (one row per attribute), while unpivoting does the reverse.
Power BI provides two types of gateways : On-premises data gateway and Power BI Data Gateway – Personal mode

* On-premises data gateway : The On-premises data gateway is used to connect Power BI to on-premises data sources like SQL Server, SharePoint, File Share, or other data sources residing within an organization’s network. It acts as a bridge between the cloud-based Power BI service and the on-premises data, allowing secure data transfer without exposing the data source directly to the internet.

* Use Cases : You should use the On-premises data gateway when you have data stored in on-premises databases or files, and you want to create reports and dashboards in Power BI that use this data. It enables you to keep the data within your organization’s network while still benefiting from the cloud-based visualization and collaboration capabilities of Power BI.

* Power BI Data Gateway – Personal mode : The Power BI Data Gateway – Personal mode (formerly known as the Power BI Personal Gateway) is designed for individual use or small-scale scenarios. It allows you to refresh data in Power BI datasets from data sources that require credentials, such as Excel files, SQL Server databases, or other supported sources.

* Use Cases : You should use the Power BI Data Gateway – Personal mode when you need to refresh data in a dataset stored in the Power BI service, and the data source requires credentials for access. It is useful for personal or small-team use cases where you don’t need the central management features provided by the On-premises data gateway.
There are three main connectivity modes used in Power BI.

SQL Server Import :  An SQL Server Import is the default and most common connectivity type used in Power BI. It allows you to use the full capabilities of the Power BI Desktop.


Direct Query :  The Direct Query connection type is only available when you connect to specific data sources. In this connectivity type, Power BI will only store the metadata of the underlying data and not the actual data.


Live Connection : With this connectivity type, it does not store data in the Power BI model. All interaction with a report using a Live Connection will directly query the existing Analysis Services model.

There are only 3 data sources that support the live connection method - SQL Server Analysis Services (Tabular models and Multidimensional Cubes), Azure Analysis Services (Tabular Models), and Power BI Datasets hosted in the Power BI Service.
Several data sources can be connected to Power BI, which is grouped into three main types:

* Files :

It can import data from Excel (.xlsx, .xlxm), Power BI Desktop files (.pbix) and Comma-Separated Values (.csv).


* Content Packs :

These are a collection of related documents or files stored as a group. There are two types of content packs in Power BI:

* Content packs from services providers like Google Analytics, Marketo, or Salesforce and Content packs are created and shared by other users in your organization.


* Connectors :

Connectors help you connect your databases and datasets with apps, services, and data in the cloud.
55 .
Explain how relationships are defined in Power BI Desktop?
Relationships between tables are defined in two ways:

* Manually - Relationships between tables are manually defined using primary and foreign keys.

* Automatic - When enabled, this automated feature of Power BI detects relationships between tables and creates them automatically.
56 .
What is row-level security?
Row-level security limits the data a user can view and has access to, and it relies on filters. Users can define the rules and roles in Power BI Desktop and also publish them to Power BI Service to configure row-level security.
Visualization is a graphical representation of data. We can use visualizations to create reports and dashboards.

The kinds of visualizations available in Power BI are Bar charts, Column charts, Line chart, Area chart, Stacked area chart, Ribbon chart, Waterfall chart, Scatter chart, Pie chart, Donut chart, Treemap chart, Map, Funnel chart, Gauge chart, Cards, KPI, Slicer, Table, Matrix, R script visual, Python visual, etc.
Power BI’s working system mainly comprises three steps :

* Data Integration : The first step is to extract and integrate the data from heterogeneous data sources. After integration, the data is converted into a standard format and stored in a common area called the staging area.

* Data Processing : Once the data is assembled and integrated, it requires some cleaning up. Raw data is not so useful therefore, a few transformation and cleaning operations are performed on the data to remove redundant values, etc. After the data is transformed, it is stored in data warehouses.

* Data Presentation : Now that the data is transformed and cleaned, it is visually presented on the Power BI desktop as reports, dashboards, or scorecards. These reports can be shared via mobile apps or web to various business users.
Using Power BI visualizations, you can apply customized visualizations like charts, KPIs, etc. from the rich library of PowerBI’s custom visuals. It refrains the developers from creating it from scratch using JQuery or Javascript SDK.

Once the custom visual is ready, it is tested thoroughly. Post testing, they are packaged in .pbiviz file format and shared within the organization.

Types of visuals available in Power BI are :

* Custom visual files.
* Organizational files.
* Marketplace files
60 .
How can you depict a story in Power BI?
In Power BI, you can depict a story or narrative by using the “Bookmarks” and “Buttons” features to create interactive and sequential presentations of your data visualizations. This allows you to guide the audience through a series of insights or data points in a storytelling manner.
KPIs (Key Performance Indicators) in Power BI are a type of visual that represents a specific metric or measure critical for assessing the performance of a business, project, or process.

KPIs help organizations monitor progress toward their goals and objectives and make informed data-driven decisions. In Power BI, KPIs are displayed as single data points or small charts that provide a quick summary of performance against predefined targets.
62 .
Is there any way to dynamically change the value measure to show multiple measures?
Yes. You can dynamically change the value measure to show multiple measures using the harvesting measure and switch function.
63 .
What is the need of signing up with a business email in Power BI?
Power BI does not support the email address given by telecommunications or consumer email service providers. That's why we need to sign up with a business email.
64 .
What is the usage of statewith() in Power BI?
In Power BI, the statewith() function returns the logical answers TRUE if the sub-string is the starting string for the superstring. If it is not, it will return false.
65 .
What are the different joins in Power BI?
There are mainly two types of joins in Power BI:

* Horizontal Joins : Horizontal Joins are used to append data from multiple tables.

* Vertical Joins : Vertical Joins are used to merge the data from multiple tables.
When data is ingested into Power BI, it is basically stored in Fact and Dimension tables.

* Fact tables : The central table in a star schema of a data warehouse, a fact table stores quantitative information for analysis and is not normalized in most cases.

* Dimension tables : It is just another table in the star schema that is used to store attributes and dimensions that describe objects stored in a fact table.
Anyone and everyone can use PowerBI to their advantage. But even then a specific set of users are more likely to use it viz :

* Business Users : Business users are the ones who constantly keep an eye on the reports to make important business decisions based on the insights.

* Business Analysts : Analysts are the ones who create dashboards, reports, and visual representations of data to study the dataset properly. Studying data needs an analytical eye to capture important trends within the reports.

* Developers : Developers are involved while creating custom visuals to create Power BI, integrating Power BI with other applications, etc.

* Professionals : They use Power BI to check the data scalability, security, and availability of data.
68 .
What are the major differences between visual-level, page-level, and report-level filters in Power BI?
Visual-level filters are used to filter data within a single visualization.

Page-level filters are used to work on an entire page in a report, and different pages can have various filters.

Report-level filters are used to filter all the visualizations and pages in the report.
69 .
Which in-memory analytics engine does Power Pivot use?
Power Pivot uses the xVelocity engine. xVelocity can handle huge amounts of data, storing data in columnar databases. All data gets loaded into RAM memory when you use in-memory analytics, which boosts the processing speed.
70 .
What is the Advanced Editor in Power BI?
Advanced editor is used to view queries that Power BI is running against the data sources importing data. The query is rendered in M-code. Users wanting to view the query code select “Edit Queries” from the Home tab, then click on “Advanced Editor” to perform work on the query. Any changes get saved to Applied Steps in the Query Settings.
The following are the Building Blocks (or) key components of Power BI:

* Visualizations : Visualization is a visual representation of data.

Example : Pie Chart, Line Graph, Side by Side Bar Charts, Graphical Presentation of the source data on top of Geographical Map, Tree Map, etc.


* Datasets : Dataset is a collection of data that Power BI uses to create its visualizations.

Example : Excel sheets, Oracle or SQL server tables.


* Reports : Report is a collection of visualizations that appear together on one or more pages.

Example:
Sales by Country, State, City Report, Logistic Performance report, Profit by Products report etc.


* Dashboards : Dashboard is single layer presentation of multiple visualizations, i.e we can integrate one or more visualizations into one page layer.

Example :
Sales dashboard can have pie charts, geographical maps and bar charts.


* Tiles : Tile is a single visualization in a report or on a dashboard.

Example :
Pie Chart in Dashboard or Report.
72 .
What are the different tabs in the Reports development Window?
The three main tabs in the Reports development Window are as follows:

* Relationship tab
* Data Modeling Tab
* Report Tab
73 .
How many types of default Graphs (Visualizations) are available in Power BI?
There are around 26 types of default Graphs (Visualizations) are available in Power BI.
74 .
What is the difference between a new column and a new measure in Power BI?
In Power BI, a new column is an area where the physical data is stored when logic is applied. On the other hand, the measure is where the calculations are performed on the fly based on dimensions. The measure doesn't store any physical data like Column.
The most important Power BI add-ins to Excel are as follows:

* Power Query : Power Query helps in editing, loading, and finding external data.
* Power Pivot : Power Pivot is mainly used in data analysis and data modeling.
* Power View : Power View is used to design interactive and visual reports.
* Power Map : Power Map helps display insights on 3D maps.
76 .
What is Power Pivot Data Model?
The Power Pivot Data Model encompasses a range of integral elements such as data tables, data types, table relationships, and columns. These data tables act as dedicated repositories responsible for housing data associated with distinct business entities.
The Power BI mobile app allows users to access their Power BI reports and dashboards from anywhere, at any time, on their mobile devices. The app is available for both iOS and Android devices and can be downloaded for free from the respective app stores.

With the Power BI mobile app, users can :

* View interactive Power BI reports and dashboards
* Explore data and gain insights with touch-enabled visuals
* Stay up-to-date with real-time data updates
* Collaborate and share insights with others
* Save reports and dashboards for offline access
To access reports and dashboards on the go with the Power BI mobile app, users simply need to sign in with their Power BI account. Once signed in, they can browse their content library, find the report or dashboard they need, and interact with it on their mobile device.

The Power BI mobile app is especially useful for business users who need to stay informed and make decisions on-the-go. With real-time data updates, users can stay up-to-date with the latest information, even when they are away from their desk. Additionally, the app's touch-enabled visuals and easy-to-use interface make it simple to explore data and gain insights, even on a small mobile screen.
78 .
What is query collapsing?
The process of converting the steps in power query editor to SQL and executing it by the source database is called query collapsing.
79 .
What is Bookmark in Power BI?
Bookmark in Power BI helps you to capture the configured view of a report page in a specific time. This includes filter and state of visual which can use a short cut to come back to the report that you can add as a bookmark.
Creating and using custom KPIs in Power BI data models is a straightforward process that involves defining a calculation for the KPI and then using the KPI in visualizations and reports.

Here is an example of how to create a custom KPI in Power BI :

* Start by creating a data model in Power BI Desktop.
* In the "Fields" pane, right-click anywhere and select "New Measure."
* Define the calculation for the KPI. For example, you might create a KPI that calculates the average sales per customer:

Average Sales per Customer = SUM(Orders[Sales]) / COUNT(Orders[CustomerID])​
* Save the KPI.
* Use the KPI in a visualization by adding it to the "Values" field.

In this example, the KPI is a simple average calculation, but you can define more complex KPIs using DAX expressions. The resulting KPI can then be used in various visualizations, such as a card, a gauge, or a table, to provide a quick and easy way to track performance against defined targets and measure progress over time.
Power BI's built-in R and Python integration allows you to run custom machine learning models directly in reports, providing a convenient and seamless way to incorporate advanced analytics into your reporting process.

Here's an example of how you can use R to run a linear regression model in Power BI :

* Load the necessary libraries and datasets into Power BI's R environment.
library(dplyr)
library(tidyverse)

data("mtcars")​

* Run the linear regression model, using mtcars as the input data.
fit <- lm(mpg ~ wt, data = mtcars)​
* Plot the model results using a scatterplot with a regression line.
ggplot(mtcars, aes(x = wt, y = mpg)) +
  geom_point() +
  geom_smooth(method = "lm", se = FALSE)​

* Publish the report to Power BI Service and display the results in a Power BI dashboard.

By integrating R and Python into Power BI, you can leverage the power of these languages to perform advanced analytics and machine learning tasks, while still utilizing Power BI's intuitive reporting and visualization tools to communicate your results to stakeholders.
Power BI Embedded is a platform that enables developers to integrate Power BI reports and dashboards into custom applications. It provides an API and a suite of developer tools that allow developers to customize and extend the functionality of embedded reports and dashboards.

To use Power BI Embedded's API and developer tools, developers must have an active Azure subscription and an understanding of the Azure portal, Power BI, and the Power BI REST API.

Here are the steps to use Power BI Embedded's API and developer tools :

* Navigate to the Azure portal and create a new Power BI Embedded resource.
* Retrieve the workspace collection and workspace ID values from the newly created Power BI Embedded resource.
* Authenticate the user and obtain an access token by sending a POST request to the Power BI REST API.
* Use the Power BI REST API to create a new dashboard, import a report, or retrieve an existing report.
* Use the Power BI JavaScript API to embed the report or dashboard into a custom application. The API provides a set of methods and events that allow developers to interact with embedded reports and dashboards.

Here is a code snippet that shows how to use the Power BI JavaScript API to embed a report into a custom application :
<!DOCTYPE html>
<html>
<head>
  <script src="https://microsoft.github.io/PowerBI-JavaScript/demo/node_modules/jquery/dist/jquery.min.js"></script>
  <script src="https://microsoft.github.io/PowerBI-JavaScript/demo/node_modules/powerbi-client/dist/powerbi.min.js"></script>
</head>
<body>
  <div id="reportContainer"></div>
  <script>
    var models = window['powerbi-client'].models;
    var embedConfig = {
        type: 'report',
        tokenType: models.TokenType.Embed,
        accessToken: 'ACCESS_TOKEN',
        embedUrl: 'EMBED_URL',
        id: 'REPORT_ID',
        settings: {
            filterPaneEnabled: false,
            navContentPaneEnabled: false
        }
    };
    var $reportContainer = $('#reportContainer');
    var report = powerbi.embed($reportContainer.get(0), embedConfig);
  </script>
</body>
</html>​


In this code snippet, the Power BI JavaScript API is used to embed a report into a custom application. The embedConfig object defines the report to be embedded, including the access token, embed URL, report ID, and display settings. The powerbi.embed method is then used to embed the report into a container element on the page, which is identified by the $reportContainer variable.
Calculated Columns Calculated Tables Measures
Added to tables by applying DAX formula on the existing data Created using DAX formula to define values Use other DAX functions to create complex calculations
DAX formula defines values in new columns rather than querying data sources Created in both Report and Data views Used for highlighting running totals, comparing sales, sales forecasting, and other purposes
Useful when data sources do not contain data presented in the desired format Work well for intermediate calculations and the data that users want to be stored in the model Created in both Report and Data views
A powerful and flexible new tool under the Power BI umbrella, Power BI Designer empowers users to create intuitive reports and dashboards, easily and quickly and also lets the users change visual views of their data at their fingertips for better analytics and informed decision-making. This designer is a host of drag-and-drop capabilities that help users place content exactly where they want it on the report canvas in a well-structured layout.
85 .
How can geographic data be mapped into Power BI Reports?
Through a map chart and a filled map chart, Power BI makes it possible for users to visually map geographic data, both globally and regionally.

* Power BI integrates with Bing Maps to find default coordinates for locations in a process known as geocoding.

* This integration means that users do not need to provide longitude and latitude coordinates.
86 .
What is z-order in Power BI?
Z-order is a design strategy that is used for arranging visuals over shapes. Also, z-order can be defined as an implementation method that can be applied when reports have multiple elements. Further, this can also be used to refresh the display after the order of items in a report is changed.
The CALCULATE function helps calculate the sum of an entire column. It can be modified using filters.

Syntax :
CALCULATE ( [, [, [, … ]]] )​


Expression : The expression that has to be evaluated.

Filter : The filter is a boolean expression or a table expression that is supposed to define a filter.
These are the only functions that allow you to modify the filter context of tables or measures.

* You can add to the existing filter context of the queries.
* You can override the filter context from the queries.
* You can remove the existing filter context from the queries.


Limitations :

* Filter parameters will only be able to work on one column at a time.
* Filter parameters will not be able to reference a metric.
89 .
What is the difference between Distinct() and Values() in DAX?
Generally, the Distinct() and Values() functions are the same in Power BI. The only difference between them is that the Values() function don't calculate null values, whereas the Distinct() function calculates even the null values.
90 .
What is the meaning of the term data alerts in Power BI?
In Power BI, the data alerts only work on data that is refreshed. When you refresh the data, the Power BI looks to see if an alert is set for that data or not. If the data has reached an alert threshold, it triggers an alert.
91 .
What is the CORR function in Power BI, and when is it used?
CORR() is a correlation function used to provide a correlation between two distinct variables ranging from -1 to 1.
To create and use custom visuals and R scripts in Power BI, you need to follow these steps:

* Create a custom visual in R : You can create a custom visual in R using a variety of R packages such as ggplot2, plotly, etc. Once you have created your custom visual, you need to wrap it in the powerBIVisuals package to make it compatible with Power BI. Here's a simple example of creating a bar chart in R:
library(ggplot2)
library(powerBIVisuals)

powerBIBar <- function(data, visualArgs) {
  p <- ggplot(data, aes(x = data$x, y = data$y)) +
    geom_bar(stat = "identity")
  powerBIVisual(p, visualArgs)
}​


* Package the custom visual :
Once you have created your custom visual, you need to package it so that it can be easily imported into Power BI. You can do this by using the devtools package in R. Here's an example of how to package a custom visual :
library(devtools)

# Create a folder for your custom visual
create("myCustomVisual")

# Copy the code for your custom visual into a file called myCustomVisual.R

# Create a file called DESCRIPTION with the following content
Package: myCustomVisual
Type: Package
Title: My Custom Visual
Version: 0.0.1
Authors@R: person("Your Name", email = "your.email@example.com")

# Build the package
build()​

* Install the custom visual in Power BI: To install the custom visual in Power BI, you need to go to the Power BI Desktop Options dialog, select "Preview features", and then select "R script visuals". Then, you can install your custom visual by uploading the .pbiviz file that was created when you packaged your custom visual.

* Use the custom visual in Power BI: Once you have installed your custom visual, you can use it just like any other visual in Power BI. Simply select the visual in the "Visualizations" pane and add your data to the visual. You can also modify the visual using the Formatting pane.
Power BI Q&A is a natural language tool that helps in querying your data and getting the results you need from it. You do this by typing into a dialog box on your Dashboard, which the engine instantaneously generates an answer similar to Power View.

Q&A interprets your questions and shows you a restated query of what it is looking from your data. Q&A was developed by Server and Tools, Microsoft Research, and the Bing teams to give you  a complete feeling of truly exploring your data.
Many to Many relationships involve a bridge or junction table reflecting the combinations of two dimensions (e.g. doctors and patients). Either all possible combinations or those combinations that have occurred.

* Bi-Directional Crossfiltering relationships can be used in PBIX.
* CROSSFILTER function can be used in Power Pivot for Excel.
* DAX can be used per metric to check and optionally modify the filter context.
Dataset : The source used to create reports and visuals/tiles.

* A data model (local to PBIX or XLSX) or model in an Analysis Services Server
* Data could be inside of model (imported) or a Direct Query connection to a source.

Report : An individual Power BI Desktop file (PBIX) containing one or more report pages.

* Built for deep, interactive analysis experience for a given dataset (filters, formatting).
* Each Report is connected to atleast one dataset
* Each page containing one or more visuals or tiles.

Dashboard : a collection of visuals or tiles from different reports and, optionally, a pinned.

* Built to aggregate primary visuals and metrics from multiple datasets.
Following are the ways to integrate SSRS with Power BI:

* SSRS report items such as charts can be pinned to Power BI dashboards.
* By clicking the tile option in Power BI dashboards will bring users to SSRS reports
* To keep the dashboard tile refreshed, a subscription is created.
* Power BI reports will be published to the SSRS portal.
97 .
What is the Differentiate between Power BI and Power BI Pro?
Power BI offers distinct kinds of features to help you get started in searching for data in a completely new way.  Power BI Pro, on the other hand, caters to some additional features like scheduling data, live data sources, storage capacity, complete interactivity, and much more.
98 .
Is there any support by Power BI available for mobile devices?
Yes, Power BI supports mobile devices. It consists of apps for iOS devices, Windows 10 devices, and Android smartphones. You can install Power BI apps from the below app stores:

* Google Play
* Apple Store
* Windows Store
99 .
What is the use of statewith function?
This function returns the logical answers TRUE if the sub-string is the starting string for the superstring. If it is not, it will return false.
To monitor and track report activity and usage in Power BI, you can use the Power BI Audit Log and Power BI Auditing options.

The Power BI Audit Log provides a record of all activities and changes made to a Power BI report. This log includes information such as who made changes, when they made changes, and what changes were made. You can access the audit log by navigating to the "Audit Log" option in the "Settings" menu in the Power BI Service.

To enable auditing for a Power BI report, you need to use Power BI Auditing. This feature allows you to monitor and track user activity, such as accessing or modifying a report. You can enable auditing for a report in the "Audit Log" settings in the Power BI Service.
101 .
What is the need of signing up with business email?
Power BI is not supporting, the email address given by telecommunications or consumer email service providers. Thus, there is need for signing up with work email.
Power BI provides two options for creating reports with relational and multidimensional data models: Multidimensional and Power BI Tabular.

Multidimensional :

Multidimensional data models are based on the traditional OLAP (Online Analytical Processing) cube structure and are created using SQL Server Analysis Services (SSAS). To use this option, you need to create an SSAS cube and then connect it to Power BI. The cube can be hosted on-premises or in the cloud, and can be refreshed on a schedule or in real-time.

Here is an example of how to create a Power BI report with a multidimensional data model:

* Create an SSAS cube using SQL Server Data Tools (SSDT).
* Connect the cube to Power BI by selecting "Get Data" > "SQL Server Analysis Services" in the Power BI Desktop.
* Select the cube and tables you want to use in the report, and load the data into Power BI.
* Create your report by dragging and dropping fields onto the canvas, and using the Power BI visuals and formatting options to display the data.

Power BI Tabular :

Power BI Tabular is a newer, in-memory data model that is optimized for performance and scalability. This option allows you to create reports using Power BI Desktop, and the data can be refreshed in real-time or on a schedule.

Here is an example of how to create a Power BI report with a tabular data model:

* Connect to your data sources by selecting "Get Data" in the Power BI Desktop. You can connect to a variety of sources, including Excel workbooks, databases, and cloud-based services.
* Load the data into Power BI by selecting the tables and columns you want to use in the report.
* Create relationships between the tables as needed.
* Create your report by dragging and dropping fields onto the canvas, and using the Power BI visuals and formatting options to display the data.
103 .
What is the SIGN function?
Sign function returns the direction of the values. If it returns 1, if positive then 1, if 0 then 0.
104 .
What is the main difference between LTRIM and RTRIM?
LTRIM function helps you to remove the white space from the LEFT of the string. RTRIM helps you to remove it from the right the last index.
105 .
What is the use of ENDSWITH function and IFNULL function?
ENDSWITH function helps you to return the logical result to the given string. In case If the sub-string is available at the end of the sub string, then it returns TRUE.

If the value is not NULL iFNULL function result is the first expression, if it is not, then it will return the second expression.