Google News
logo
Site Reliability Engineer (SRE) Interview Questions
Site Reliability Engineering (SRE) is a discipline or approach to managing and maintaining complex, large-scale software systems with a focus on reliability, scalability, and performance. SRE combines software engineering and operations to ensure that systems are reliable, efficient, and resilient in production environments.

The concept of SRE was popularized by Google, where it originated as an internal team responsible for managing Google's vast infrastructure and services. SRE teams aim to bridge the gap between traditional software development and operations, emphasizing the importance of collaboration and shared responsibility.

Responsibilities of Site Reliability Engineer

* Site reliability engineers collaborate with other engineers, product owners, and customers to develop goals and metrics. This assists them in ensuring system availability. Once everyone has agreed on a system's uptime and availability, it is simple to determine the best moment to act.

* Site Reliability Engineer implements error budgets to assess risk, balance availability, and drive feature development. When there are no unreasonable reliability expectations, a team has the freedom to make system upgrades and changes.

* SRE is committed to decreasing labour. As a consequence, jobs that require a human operator to operate manually are automated.
SRE (Site Reliability Engineering) and DevOps are related but distinct approaches to managing and delivering software systems. While there is some overlap between the two, there are key differences in their focus and scope:

1. Focus :

* SRE primarily focuses on ensuring the reliability and availability of systems in production environments. It emphasizes monitoring, incident response, reliability engineering, and system scalability.

* DevOps, on the other hand, is a broader approach that aims to improve collaboration and communication between development and operations teams throughout the software development lifecycle. It encompasses practices such as continuous integration, continuous delivery, infrastructure automation, and cultural aspects of collaboration.

2. Goals :

* The primary goal of SRE is to maximize system reliability, typically measured through Service Level Objectives (SLOs) and error budgets. SRE teams focus on reducing incidents, minimizing downtime, and meeting or exceeding reliability targets.

* DevOps, on the other hand, aims to improve software delivery speed, quality, and efficiency by breaking down organizational silos and fostering a culture of collaboration and shared responsibility.

3. Role and Responsibilities :

* SRE teams are often specialized groups within an organization that focus on ensuring the reliability of systems in production. They apply software engineering principles to operations, building tools, automation, and frameworks to manage and maintain infrastructure and services.

* DevOps, on the other hand, is more of a cultural and organizational philosophy that promotes cross-functional teams, where developers and operations professionals work closely together to deliver and operate software systems.
4. Scope :

* SRE is typically more focused on production operations and managing the reliability and scalability of systems already in production. It includes activities like incident response, monitoring, capacity planning, and performance optimization.

* DevOps has a broader scope, encompassing the entire software development lifecycle, including development, testing, deployment, and operations. It aims to improve collaboration, automation, and efficiency across all stages of the software delivery process.

5. Origin :

* SRE was originally developed at Google as an approach to manage their complex infrastructure and services. It has since been adopted by many other organizations.

* DevOps emerged as a response to the challenges of traditional siloed development and operations practices, aiming to break down barriers and improve collaboration between the two disciplines.

Note : That SRE and DevOps are not mutually exclusive. In fact, they can complement each other. Many organizations incorporate SRE principles and practices within their DevOps approach to enhance reliability and system resiliency.
The key principles of Site Reliability Engineering (SRE) include :

1. Reliability : The primary goal of SRE is to ensure the reliability of systems. This involves setting and meeting Service Level Objectives (SLOs) and managing error budgets. SRE teams focus on building resilient systems and reducing service disruptions.

2. Automation : SRE emphasizes automating repetitive tasks and manual processes to increase efficiency, reduce human error, and enable scalability. Automation is applied to various areas, including deployment, monitoring, incident response, and recovery processes.

3. Monitoring and Alerting : SRE teams implement robust monitoring and alerting systems to gain visibility into system behavior and detect anomalies. Monitoring helps identify performance issues, capacity constraints, and potential failures, allowing proactive action to maintain system health.

4. Incident Response : SRE follows well-defined incident response practices. When incidents occur, SRE teams respond quickly, investigate root causes, and restore service as efficiently as possible. Blameless postmortems are conducted to learn from incidents, improve system reliability, and prevent future recurrences.

5. Capacity Planning : SRE includes capacity planning to ensure systems have enough resources to handle expected workloads. This involves analyzing usage patterns, predicting future demands, and scaling systems accordingly. Capacity planning helps maintain performance, avoid bottlenecks, and handle traffic spikes.
6. Performance Optimization : SRE focuses on optimizing system performance to provide optimal user experiences. This includes identifying and resolving performance bottlenecks, reducing latency, optimizing resource utilization, and improving response times.

7. Change Management : SRE emphasizes careful change management processes to minimize disruptions and ensure changes are thoroughly tested and rolled out safely. Change management involves evaluating risks, maintaining proper documentation, and following standardized procedures for deploying changes to production systems.

8. Collaboration and Shared Responsibility : SRE promotes strong collaboration between development, operations, and other teams involved in the software lifecycle. It fosters a culture of shared responsibility for system reliability and encourages cross-functional collaboration to drive improvements.

9. Continuous Improvement : SRE follows a culture of continuous improvement. SRE teams regularly review systems, processes, and incidents to identify areas for improvement. They seek to implement incremental changes, adopt new technologies, and refine practices to enhance system reliability and performance over time.

These principles collectively aim to achieve reliable, scalable, and efficient systems while balancing the need for innovation and feature development. By applying these principles, SRE teams can increase system stability, reduce downtime, and deliver a better user experience.
Interacting with a DevOps team requires effective collaboration, communication, and a shared understanding of goals and responsibilities. Here are some key points to consider when interacting with a DevOps team:

1. Establish Clear Channels of Communication : Ensure there are clear channels of communication established between your team and the DevOps team. This can include regular meetings, shared communication tools (e.g., chat platforms), and documentation repositories.

2. Foster a Collaborative Environment : Encourage a culture of collaboration and mutual respect between your team and the DevOps team. Emphasize the shared goal of delivering reliable and high-quality software. Foster an environment where ideas, concerns, and feedback can be freely shared.

3. Define Roles and Responsibilities : Clearly define the roles and responsibilities of both teams. Understand the areas of overlap and where handoffs occur. This clarity helps avoid misunderstandings and ensures that each team knows what is expected of them.

4. Involve DevOps Early in the Software Development Lifecycle : Include DevOps team members early in the software development process, such as during the planning and design stages. This helps ensure that operational requirements, such as deployment, monitoring, and scalability, are considered from the beginning.

5. Collaborate on Infrastructure and Deployment : Work closely with the DevOps team on infrastructure provisioning, configuration management, and deployment processes. Provide them with necessary information and collaborate on defining infrastructure requirements, automation scripts, and deployment pipelines.
6. Share Knowledge and Expertise : Encourage knowledge sharing between teams. If your team has specific domain knowledge, share it with the DevOps team to help them better understand the software and its operational requirements. Similarly, be open to learning from the DevOps team's expertise in managing infrastructure and deployment processes.

7. Collaborate on Monitoring and Alerting : Work together on defining and implementing monitoring and alerting systems. Discuss the critical metrics to track, thresholds for alerts, and the processes for incident response and resolution.

8. Continuous Improvement : Embrace a culture of continuous improvement together with the DevOps team. Collaborate on identifying areas for optimization, automation, and efficiency gains. Regularly review processes and incidents to learn from them and drive improvements.

9. Provide Feedback and Support : Offer constructive feedback and support to the DevOps team. Recognize their efforts and contributions. If you encounter any issues or concerns, address them promptly and work together to find solutions.
Defining and measuring reliability involves assessing the ability of a system to perform its intended functions without failure or downtime. Here are key steps to define and measure reliability:

1. Define Reliability : Start by establishing a clear definition of reliability that aligns with your specific system or service. Reliability can be defined as the probability that a system will function without failure over a specified period under given conditions.

2. Identify Key Metrics : Determine the metrics that will be used to measure reliability. These metrics may include availability, uptime, mean time between failures (MTBF), mean time to repair (MTTR), error rates, response times, or customer satisfaction scores. Choose metrics that are meaningful and relevant to your system and its users.

3. Set Service Level Objectives (SLOs) : SLOs define the acceptable level of reliability for your system. They establish specific targets for the metrics identified in the previous step. SLOs should be realistic, achievable, and aligned with the expectations of your users or customers. For example, you may set an availability target of 99.9% for your service.
4. Measure Reliability : Implement robust monitoring and observability systems to collect data on the defined metrics. Use appropriate tools and technologies to track the performance and behavior of your system. Monitor key indicators such as uptime, error rates, response times, or any other relevant metrics. These measurements provide a quantitative assessment of the reliability of your system.

5. Analyze and Evaluate : Regularly analyze the collected data to evaluate the system's reliability performance. Identify patterns, trends, and areas of improvement. Compare the actual metrics against the established SLOs to determine whether the system is meeting the desired reliability targets.

6. Iterate and Improve : Use the insights gained from the analysis to drive improvements. Implement corrective actions or optimizations to address any shortcomings or areas where reliability falls below the defined SLOs. Continuously iterate and refine your system based on the data and feedback gathered.

7. Seek User Feedback : Engage with your users or customers to gather qualitative feedback on their perception of the system's reliability. Conduct surveys, interviews, or usability tests to understand their experiences and satisfaction levels. Incorporate this feedback into your reliability assessment and improvement efforts.

Remember that reliability is not an absolute measure but rather a goal to strive for. It requires continuous monitoring, analysis, and improvement efforts to ensure that the system meets the expectations of its users or customers.
When developing an algorithm, several important criteria should be considered to ensure its effectiveness and efficiency. Here are some key criteria to prioritize:

1. Correctness : The algorithm should produce the correct and expected output for all possible inputs. It should solve the problem it aims to address accurately. Thoroughly analyze and test the algorithm to verify its correctness under different scenarios and edge cases.

2. Efficiency : Efficiency refers to the algorithm's performance in terms of time and space complexity. Strive to develop algorithms that execute quickly and utilize minimal resources. Consider the scalability of the algorithm as input sizes increase. Aim for the most efficient algorithm that meets the requirements of the problem.

3. Clarity and Readability : The algorithm should be easy to understand and maintain. Use clear and descriptive variable names, provide comments where necessary, and follow good coding practices. A readable algorithm enhances collaboration, makes debugging easier, and facilitates future modifications.

4. Robustness : An algorithm should handle various inputs and edge cases without breaking or producing incorrect results. Consider potential error conditions and handle exceptions gracefully. Perform thorough testing to ensure the algorithm behaves correctly and predictably under different scenarios.
5. Reusability : Aim to develop algorithms that can be easily reused or adapted for similar problems or in different contexts. Modularize the algorithm into smaller components or functions that can be utilized independently or combined with other algorithms.

6. Optimality : Depending on the problem and requirements, strive to develop algorithms that achieve optimal or near-optimal solutions. This may involve analyzing trade-offs between time complexity and solution quality. Optimal algorithms provide the best possible solution within the given constraints.

7. Consideration of Constraints : Consider any constraints or limitations imposed by the problem domain, such as memory restrictions, computational constraints, or specific requirements. Develop algorithms that respect and work within these constraints.

8. Error Handling and Exceptional Cases : Account for potential errors, edge cases, and exceptional scenarios that may arise during algorithm execution. Implement proper error handling and recovery mechanisms to handle such situations gracefully and avoid unexpected failures.

9. Maintainability : Ensure that the algorithm is maintainable and easily modifiable as requirements evolve or change. Structure the code in a way that allows for future enhancements or modifications without significant rework. Maintainable algorithms are adaptable and facilitate long-term sustainability.

10. Consideration of Trade-Offs : Sometimes, different algorithmic approaches may involve trade-offs between criteria such as time complexity, space complexity, or solution quality. Consider the trade-offs and make informed decisions based on the specific requirements and constraints of the problem.
There are various tools and technologies available for monitoring system performance. The specific choice of tools depends on the nature of the system, the scale of operations, and the specific metrics or aspects you want to monitor. Here are some commonly used tools and technologies for monitoring system performance:

1. Monitoring Platforms :
   * Prometheus: A widely used open-source monitoring and alerting toolkit with a flexible query language (PromQL).
   * Grafana: A popular open-source platform for visualizing and analyzing metrics from various data sources, including Prometheus.
   * Datadog: A cloud-based monitoring and analytics platform that offers real-time visibility into system performance and metrics.

2. Logging and Log Analysis :
   * ELK Stack (Elasticsearch, Logstash, and Kibana): A popular open-source stack for collecting, processing, and analyzing log data.
   * Splunk: A powerful commercial platform for collecting, indexing, and analyzing machine-generated data, including logs.

3. Infrastructure Monitoring :
   * Nagios: A widely used open-source monitoring system that provides comprehensive monitoring and alerting capabilities.
   * Zabbix: An open-source monitoring solution that offers real-time monitoring, alerting, and visualization of infrastructure components.
4. Application Performance Monitoring (APM) :
   * New Relic: A cloud-based APM platform that provides deep insights into the performance of applications, including code-level analysis and transaction tracing.
   * AppDynamics: A comprehensive APM tool that offers real-time monitoring, performance diagnostics, and end-user experience monitoring.

5. Distributed Tracing :
   * Jaeger: An open-source end-to-end distributed tracing system that helps visualize and analyze transaction traces across microservices.

6. Real User Monitoring (RUM) :
   * Google Analytics: A web analytics tool that provides insights into user behavior, page load times, and other user-centric metrics.

7. Synthetic Monitoring :
   * Pingdom: A cloud-based synthetic monitoring tool that checks the availability and performance of websites and web applications from various locations.

8. Container and Orchestration Monitoring :
   * Kubernetes Dashboard: A web-based interface for visualizing and managing Kubernetes clusters, including monitoring cluster health and resource usage.
   * Prometheus Operator: A Kubernetes-native monitoring and alerting solution that automatically configures Prometheus for monitoring applications running in Kubernetes.
Capacity planning involves determining the resources required to meet current and future demand for your system. It helps ensure that your infrastructure can handle the anticipated workload without performance degradation or service disruptions. Here's an approach to capacity planning:

1. Understand the System : Gain a thorough understanding of your system's architecture, components, and dependencies. Identify the critical resources that impact performance, such as CPU, memory, storage, network bandwidth, and database connections.

2. Define Performance Goals : Establish clear performance goals and metrics for your system, such as response time, throughput, and concurrency. Determine the acceptable performance thresholds and service level objectives (SLOs) for your system.

3. Collect and Analyze Historical Data : Gather historical data on resource utilization, performance metrics, and workload patterns. Analyze this data to identify usage patterns, peak loads, and growth trends. Use this information to identify seasonal variations, recurring patterns, and areas of resource contention.

4. Forecast Future Workload : Use the historical data and knowledge of upcoming changes (e.g., new features, marketing campaigns, expected user growth) to forecast future workload. Consider factors such as user traffic, transaction volumes, data growth, and system usage patterns. Account for expected changes in usage patterns, potential spikes, and growth over the planning horizon.
5. Estimate Resource Requirements : Based on the workload forecast, estimate the resources needed to handle the anticipated demand. Consider both vertical scaling (increasing the capacity of existing resources) and horizontal scaling (adding more resources or nodes).

6. Perform Capacity Testing : Conduct capacity testing to validate your resource estimates and assess system performance under realistic conditions. Simulate the anticipated workload to measure the system's response and identify any performance bottlenecks or limitations. Use the results to refine your capacity planning estimates and identify potential areas for optimization.

7. Monitor and Analyze in Production : Continuously monitor your system in production to gather real-time data on resource utilization, performance metrics, and user behavior. Leverage monitoring tools and techniques to identify any deviations from expected patterns, resource constraints, or performance issues. Analyze this data to detect trends, adjust capacity planning estimates, and optimize resource allocation.

8. Plan for Scalability and Redundancy : Consider scalability and redundancy in your capacity planning. Account for future growth by designing your system to scale horizontally or vertically. Implement load balancing, caching, distributed architectures, and other techniques to handle increased demand and ensure high availability.

9. Review and Iterate : Regularly review and iterate on your capacity planning approach. Evaluate the accuracy of your forecasts and resource estimates. Learn from past experiences and make adjustments to your planning methodology based on observed performance, changes in workload patterns, or evolving business requirements.
Data structures are a set of rules for organizing and storing data in a computer. Data structures are used to structure databases, manage memory, and organize data. Data structures allow for easy organization of data, easy retrieval of data, and efficient use of resources.

Physical Data Structures can be Arrays and Linked lists. We can call these two physical data structures because the data stored in the actual physical memory, are based on these two. An array is the collection of contiguous data elements of the same type. And the linked list is also the collection of the data elements but it may or may not be contiguous in memory. A linked list consists of nodes that store the data and also the pointer that is pointing to the next node in the memory.

Logical Data Structure can be considered as all the data structures that are constructed while using the two physical data structures. The logical data structures can be stack, queue, tree, graph, etc. These data structures have only the logic and based on this logic it defines a property and stores the data using arrays and linked lists in the memory.
Creating tests for software performance and reliability involves designing and executing tests that assess the system's behavior under different load conditions and ensure its stability and robustness. Here's an approach to creating tests for software performance and reliability:

1. Define Performance and Reliability Goals : Start by defining clear goals and metrics for performance and reliability. Identify key performance indicators (KPIs) such as response time, throughput, resource utilization, and error rates. Determine reliability metrics such as mean time between failures (MTBF) or availability targets. These goals will guide your testing efforts.

2. Identify Test Scenarios : Identify and define test scenarios that cover different usage patterns, load levels, and potential stress conditions. Consider both normal and peak workload scenarios. Test scenarios should mimic real-world scenarios and cover critical functionalities and use cases of the system.

3. Design Performance Tests :
   * Load Testing: Simulate user traffic and measure system performance under expected load conditions. Gradually increase the load until you reach the desired concurrency or throughput levels. Measure response times, resource utilization, and system behavior under various load levels.
   * Stress Testing: Push the system beyond its normal capacity to identify its breaking point or failure conditions. Apply extreme or unexpected loads to test system stability, identify bottlenecks, and understand the system's behavior under stress.
   * Endurance Testing: Run tests for an extended duration to assess the system's ability to handle sustained loads. Monitor resource utilization, memory leaks, and potential performance degradation over time.
   * Spike Testing: Generate sudden and significant spikes in load to assess the system's ability to handle sudden increases in traffic or workload. Measure how the system recovers from these spikes and whether it maintains stability.
   * Scalability Testing: Test the system's ability to scale horizontally or vertically. Increase the load gradually while adding or removing resources to evaluate how the system responds and performs as it scales.
4. Design Reliability Tests :
   * Fault Injection Testing: Introduce deliberate faults or failures to assess how the system handles them. Examples include simulating network failures, server crashes, or database outages. Measure system recovery, error handling, and fault tolerance mechanisms.
   * Data Integrity Testing: Validate the system's ability to maintain data integrity and consistency. Introduce scenarios such as concurrent access, data corruption, or replication issues to verify the system's resilience and ability to recover from data-related problems.
   * Failure Recovery Testing: Simulate system failures and measure the time it takes for the system to recover and resume normal operations. Test backup and restore mechanisms, fault detection, and automatic recovery processes.

5. Test Environment Setup : Create a dedicated test environment that closely resembles the production environment in terms of hardware, software configurations, and network conditions. Ensure the environment is isolated, scalable, and capable of generating the desired load.

6. Test Data Preparation : Prepare realistic and representative test data that covers a range of scenarios and edge cases. Use data generation tools or anonymize production data to ensure data privacy.

7. Execute Tests and Monitor : Execute the designed tests and closely monitor the system's behavior during test runs. Monitor performance metrics, resource utilization, response times, and error rates. Use specialized tools for load generation and performance monitoring.

8. Analyze Results : Analyze the test results, compare them against the defined goals and metrics, and identify any performance bottlenecks, scalability issues, or reliability concerns. Use the insights gained to optimize the system, fix identified issues, and improve performance and reliability.

9. Iterate and Repeat : Perform iterative testing and refinement based on the analysis of test results. Address any identified issues, make necessary adjustments, and rerun tests to validate the improvements.
A Service Level Objective (SLO) is a measurable target that defines the level of service a system or service should provide to its users or customers. It is a specific goal or performance metric that outlines the quality and reliability expected from the system. SLOs are typically defined in terms of quantitative metrics and are used to establish clear expectations and commitments regarding system performance and availability.

Here are a few key characteristics of SLOs :

1. Measurable : SLOs should be measurable and quantifiable. They are typically expressed as specific numerical values or ranges tied to performance metrics. For example, an SLO may specify a response time target of 200 milliseconds or an availability target of 99.9%.

2. Time-Bound : SLOs are defined within a specific time frame or window. For example, an SLO might state that 99% of requests should be processed within 1 second over a 24-hour period.

3. Meaningful and Relevant : SLOs should be meaningful and relevant to the system's users or customers. They should align with their expectations, needs, and the overall purpose of the system. SLOs may differ based on different user segments, service tiers, or criticality levels.

4. Agreed Upon : SLOs are established through collaboration and agreement between the service provider and the stakeholders, such as product managers, customers, or business owners. It is crucial to have a shared understanding and consensus on the SLOs.

5. Continuous Monitoring and Evaluation : SLOs are continuously monitored and evaluated to assess whether the system is meeting the defined targets. The performance metrics associated with SLOs are regularly measured, and any deviations or violations trigger alerts or notifications for investigation and remediation.

SLOs play a vital role in managing and improving system reliability, performance, and user satisfaction. They help set expectations, guide engineering efforts, prioritize optimizations, and enable data-driven decision-making. By defining and monitoring SLOs, organizations can track the health of their systems, identify areas for improvement, and ensure that the delivered service meets the desired quality standards.
service-level objectives ensure reliability. Generally, service level objectives are important because they help teams achieve the following:

Improve software quality : Service level objectives help teams define an acceptable level of downtime for a service or a particular issue. SLOs can shine light on issues that fall short of a full-blown incident, but also don’t fully meet expectations. Achieving 100% reliability isn’t always realistic, so using SLOs can help you figure out the balance between innovating (which could result in downtime) and delivering (which ensures users are happy).

Help with decision making : SLOs can be a great way for DevOps and infrastructure teams to use data and performance expectations to make decisions, such as whether to release, and where engineers should focus their time.

Promote automation : Stable, well-calibrated SLOs pave the way for teams to automate more processes and testing throughout the software delivery life cycle (SDLC). With reliable SLOs, you can set up automation to monitor and measure SLIs and set alerts if certain indicators are trending toward violation. This consistency enables teams to calibrate performance during development and detect issues before SLOs are actually violated.

Avoid downtime : It is inevitable that software can break. SLOs allow DevOps teams to predict the problems before they occur and especially before they impact customers. By shifting production-level SLOs left into development, you can design apps to meet production SLOs to increase resilience and reliability far before there is actual downtime. This trains your teams to be proactive in maintaining software quality and saves you money by avoiding downtime.
Setting appropriate Service Level Objectives (SLOs) requires a thoughtful and data-driven approach to ensure they align with user expectations and the overall goals of the service. Here's a step-by-step process to set appropriate SLOs for a service:

1. Understand User Expectations : Gain a deep understanding of the user base, their needs, and their expectations regarding the service. Conduct user surveys, interviews, or feedback analysis to gather insights into what users consider important in terms of performance, availability, and quality.

2. Define Service Goals : Define the overarching goals and objectives of the service. These goals should align with the business objectives and reflect the desired level of service quality. For example, the goals could include providing a fast and responsive user experience, high availability, or accurate and reliable data.

3. Identify Critical Metrics : Identify the key performance indicators (KPIs) and metrics that are relevant to the service and align with user expectations. These metrics could include response time, throughput, error rate, availability, latency, or any other measure that directly impacts user experience and satisfaction.

4. Analyze Historical Data : Analyze historical performance data and usage patterns to understand the service's past performance, peak loads, and any existing performance bottlenecks. Identify the thresholds or benchmarks that have been met or missed in the past and use them as a starting point for defining SLOs.

5. Determine Performance Targets : Based on the analysis of user expectations, service goals, and historical data, set appropriate performance targets for each identified metric. Consider the trade-offs between user experience, system complexity, cost, and technical feasibility. It may be helpful to consult with cross-functional teams, including product managers, engineers, and business stakeholders, to ensure a well-rounded perspective.
6. Quantify SLOs : Express the SLOs in quantifiable and measurable terms. Define specific numerical values or ranges that represent the desired level of performance. For example, an SLO could be defined as "95% of requests should be completed within 200 milliseconds" or "the service should have at least 99.9% availability over a monthly period."

7. Set Realistic and Attainable Targets : Consider the capabilities and limitations of the current system architecture, infrastructure, and resources. Ensure that the defined SLOs are realistic and attainable within the existing constraints. Setting overly aggressive or unachievable targets can lead to frustration and dissatisfaction.

8. Align with Business Priorities : Ensure that the defined SLOs align with the business priorities and customer value. Consider the impact of the SLOs on revenue, customer retention, brand reputation, and overall business success. Balance the desired service quality with the cost and effort required to achieve it.

9. Monitor and Refine : Implement robust monitoring and alerting mechanisms to continuously track the service's performance against the defined SLOs. Regularly analyze the data, identify areas of improvement, and refine the SLOs based on user feedback, changing business needs, or evolving technology.

10. Communicate and Educate : Clearly communicate the defined SLOs to all stakeholders, including the development team, operations team, product managers, and customers. Ensure that there is a shared understanding of the SLOs and their significance. Educate stakeholders about the implications of meeting or violating the SLOs and the actions taken to improve performance.
Cloud-native software and its supporting tools and infrastructure generate various metrics and data points every second that indicate a system’s state and performance. Service-level objectives define or support a set of higher-level business goals, which you can measure by leveraging the data and insights from observability tools.

The goal of SLOs is to deliver more reliable, resilient, and responsive services that meet or exceed user expectations. Reliability and responsiveness are often measured in nines on the way to 100%. For example, an objective for system availability can be:

* 90% – one 9
* 99% – two 9s
* 99.9% – three 9s
* 99.99% – four 9s
* 99.999% – five 9s

Each decimal point closer to 100 usually involves greater cost and complexity to achieve. Users may require a certain level of responsiveness, after which they can no longer detect a difference. Setting SLOs is part science and part art, striking a balance between statistical perfection and realistic goals.

You can set service level objectives based on individual indicators, such as batch throughput, request latency, and failures-per-second. You can also create SLOs based on aggregate indicators, for example, the application performance index (Apdex), an industry standard that measures user satisfaction based on a variety of metrics.

Gathering and analyzing metrics over time will help you determine the overall effectiveness of your SLOs so you can tune them as your processes mature and improve. These trends also help you adjust business objectives and SLAs.
An error budget is a concept closely related to Service Level Objectives (SLOs) and is used to manage the trade-off between system reliability and the pace of innovation or deployment of new features. It provides a mechanism to balance the need for system stability with the desire to introduce changes and iterate rapidly.

In the context of SLOs, an error budget represents the acceptable amount of error or downtime that a service or system can experience while still meeting its reliability targets. It quantifies the permissible deviation from the defined SLOs and serves as a budget or allowance for service disruptions or performance issues.

Here's how error budgets and SLOs are related :

* SLOs Set the Performance Targets : SLOs define the desired level of service performance, such as response time, availability, or error rates. They represent the quality of service that the system aims to provide to its users.

* Error Budget Defines the Tolerance for Errors : The error budget is derived from the SLOs and represents the allowable margin of error or deviation from the target performance. It quantifies how much downtime, errors, or degraded performance the system can experience without violating the SLOs.

* Monitoring and Calculating the Error Budget : The system's performance is continuously monitored, and the actual performance metrics are compared against the defined SLOs. Any deviation from the targets results in consuming a portion of the error budget. For example, if the response time exceeds the defined threshold, it reduces the available error budget.
* Balancing Stability and Innovation : The error budget serves as a mechanism to balance system stability with the need for innovation and deployment of new features. As long as the error budget is not fully consumed, the development team has flexibility to make changes, deploy updates, and iterate on the system without violating the SLOs.

* Decision Making Based on Error Budget : When considering making changes or introducing new features, the development team considers the available error budget. If the error budget is running low, it indicates that the system is becoming less reliable, and the team needs to prioritize stability over making further changes. If the error budget is ample, it allows for more experimentation and innovation.

* Resetting the Error Budget : The error budget is typically reset over a specific time period, such as monthly or quarterly. At the end of the period, if the error budget has not been fully consumed, it may roll over to the next period. If the error budget is exhausted, it indicates a need to focus on reliability improvements before making further changes.

The concept of error budgets encourages a balance between reliability and innovation by providing a measurable and tangible representation of acceptable errors or disruptions. It allows development teams to have a structured approach to prioritize stability while still enabling agility and continuous improvement in the system.
When monitoring system or application performance, several metrics can provide valuable insights into the health, efficiency, and effectiveness of the system. The choice of metrics may vary depending on the specific requirements and characteristics of the system, but here are some commonly used metrics for system or application performance monitoring :

1. Response Time : Measures the time taken for the system to respond to a request or perform an operation. It indicates the system's speed and responsiveness from the user's perspective.

2. Throughput : Represents the number of transactions or operations the system can handle within a given time frame. It indicates the system's capacity to handle a certain volume of requests or workload.

3. Error Rate : Measures the frequency or percentage of errors encountered during system operations. It helps identify issues, such as software bugs, network problems, or configuration errors, that affect the system's reliability.

4. CPU Utilization : Indicates the percentage of the central processing unit's capacity being utilized by the system. High CPU utilization may indicate resource constraints or bottlenecks that can impact performance.
5. Memory Utilization : Measures the amount of memory used by the system or application. High memory utilization can lead to performance degradation or even crashes.

6. Disk I/O : Tracks the input/output operations performed on disk storage. Monitoring disk I/O helps identify potential disk bottlenecks or storage performance issues.

7. Network Latency : Measures the time taken for data packets to travel between different components or systems over the network. Network latency impacts the responsiveness and speed of communication between system components.

8. Database Performance Metrics : Depending on the presence of a database, specific metrics such as query response time, transaction throughput, and database connection pool utilization can provide insights into the performance of database operations.

9. Error Logs and Exceptions : Monitoring error logs and capturing exceptions helps identify and diagnose specific errors, exceptions, or abnormal behaviors occurring within the system. These logs can provide valuable information for troubleshooting and performance improvement.

10. User or Customer Experience Metrics : User-centric metrics, such as page load time, click-through rates, or conversion rates, provide insights into the user experience and the impact of performance on user behavior and satisfaction.
Balancing feature development with operational work is a crucial aspect of managing a software system or service. While feature development focuses on delivering new functionality and improving user experience, operational work involves tasks related to maintaining system stability, performance, and reliability. Here are some strategies to help balance these two aspects effectively:

1. Define Priorities : Clearly define and prioritize the key objectives and goals for both feature development and operational work. Understand the business requirements, user needs, and criticality of each aspect to allocate appropriate resources and efforts.

2. Adopt Agile Practices : Implement agile methodologies, such as Scrum or Kanban, to promote flexibility and collaboration. Divide work into manageable iterations, plan sprints, and allocate capacity for both feature development and operational tasks within each iteration.

3. Dedicated Operational Resources : Assign a dedicated team or individuals responsible for operational work, such as monitoring, incident response, and system maintenance. By separating these responsibilities, the development team can focus on feature development while the operational team ensures system stability.

4. Automation and Tooling : Invest in automation and tooling to streamline operational tasks. Implement monitoring and alerting systems, automated testing frameworks, deployment pipelines, and infrastructure-as-code practices. Automation reduces manual effort and allows teams to allocate more time to feature development.

5. Time Allocation : Allocate a portion of each team member's time specifically for operational work. For example, allocate a percentage of their working hours or designate specific days for operational tasks. This ensures a balanced approach and prevents operational work from being neglected.

6. Continuous Improvement : Encourage a culture of continuous improvement for both feature development and operational work. Regularly review and refine processes, identify bottlenecks or pain points, and implement changes to optimize efficiency and effectiveness.

7. Collaborative Communication : Foster open and transparent communication between development teams and operational teams. Encourage regular meetings, joint planning sessions, and knowledge sharing to align priorities, identify dependencies, and foster collaboration.

8. Measure and Optimize : Establish metrics and performance indicators for both feature development and operational work. Regularly measure and analyze these metrics to identify areas for improvement, address inefficiencies, and adjust resource allocation as needed.

9. Incident Management : Implement a robust incident management process to effectively handle and respond to incidents. Define roles, responsibilities, and escalation paths to ensure that operational issues are promptly addressed while minimizing disruption to feature development.

10. Continuous Learning : Encourage a culture of learning and knowledge sharing within the team. Provide opportunities for professional development, cross-training, and sharing best practices. This helps team members gain a broader understanding of the system and reduces dependencies on specific individuals.
Blameless postmortems, also known as blameless retrospectives or incident reviews, are a practice within the Site Reliability Engineering (SRE) and DevOps culture that aims to foster a blame-free and learning-oriented environment when investigating and analyzing incidents or system failures. The concept emphasizes understanding the underlying causes and systemic issues rather than assigning blame to individuals or teams.

Here are the key aspects and importance of blameless postmortems:

1. Psychological Safety : Blameless postmortems create a psychologically safe space for individuals to openly share their experiences, observations, and contributions to an incident without fear of punishment or retribution. This encourages transparency, honesty, and collaboration, leading to more accurate and comprehensive incident analysis.

2. Learning Opportunity : Blameless postmortems focus on learning and improvement rather than pointing fingers. They provide a valuable opportunity to understand the root causes, contributing factors, and systemic weaknesses that led to an incident. This knowledge can then be used to implement preventive measures and improve system resilience.

3. Systemic Perspective : Blameless postmortems shift the focus from individual mistakes to systemic issues. They aim to identify underlying problems in processes, communication, tooling, or system architecture that contributed to the incident. By addressing these systemic issues, teams can prevent similar incidents from occurring in the future.
4. Trust and Collaboration : Blameless postmortems foster a culture of trust and collaboration. By removing the fear of blame, individuals are more willing to share their insights, observations, and suggestions for improvement. This collective effort promotes cross-functional collaboration, knowledge sharing, and the development of effective solutions.

5. Continuous Improvement : Blameless postmortems play a crucial role in the continuous improvement of systems and processes. They enable teams to reflect on their practices, identify areas for enhancement, and implement changes to prevent future incidents. By learning from mistakes and implementing corrective actions, teams can increase system reliability and reduce the likelihood of recurring incidents.

6. Accountability without Blame : Blameless postmortems don't imply a lack of accountability. Instead, they shift the focus from individual blame to collective responsibility for system health and reliability. The emphasis is on understanding the contributing factors, learning from the incident, and taking ownership of improvements to prevent similar issues in the future.

7. Cultural Transformation : Embracing blameless postmortems requires a cultural shift within organizations. It encourages open communication, trust, and a growth mindset. It enables teams to view incidents as learning opportunities rather than occasions for blame, fostering a culture of continuous learning and improvement.
Site Reliability Engineering (SRE) team for log analytics ,Here are a few examples:

1. Elasticsearch : Elasticsearch is a widely used open-source search and analytics engine. It is often used in conjunction with other components of the Elastic Stack, such as Logstash for data ingestion and Kibana for visualization and exploration of logs.

2. Splunk : Splunk is a popular commercial log management and analysis platform. It offers features for collecting, indexing, searching, and analyzing log data from various sources. Splunk supports powerful search capabilities and provides visualizations, dashboards, and alerting mechanisms.

3. Graylog : Graylog is an open-source log management platform that helps collect, index, and analyze log data. It provides search functionality, dashboards, and alerting features. Graylog supports centralized log collection from various sources, including syslog, file inputs, and message queues.
4. ELK Stack : The ELK Stack combines Elasticsearch, Logstash, and Kibana to create a comprehensive log analytics solution. Logstash is used for log ingestion and transformation, Elasticsearch for indexing and search, and Kibana for visualizing and exploring log data.

5. Datadog : Datadog is a cloud monitoring and analytics platform that offers log management capabilities. It provides features for collecting, aggregating, searching, and analyzing log data. Datadog integrates with other monitoring tools and offers visualizations, alerts, and anomaly detection.

6. Prometheus and Grafana : While primarily known for time-series monitoring, Prometheus and Grafana can also be used for log analysis. Prometheus can scrape logs from targets using exporters, and Grafana provides powerful querying and visualization capabilities for log data.

These are just a few examples of tools commonly used for log analytics in an SRE context. The choice of tooling depends on various factors such as the organization's requirements, scale, budget, and existing infrastructure. It's important to evaluate different tools based on their features, scalability, ease of use, and compatibility with existing systems before selecting the most suitable one for your specific needs.
Handling incidents and performing effective incident management is crucial for maintaining system reliability and minimizing the impact of disruptions. Here are the key steps involved in handling incidents and conducting incident management:

1. Incident Identification and Escalation : Establish mechanisms to identify incidents promptly. This can be achieved through proactive monitoring, automated alerting systems, user reports, or other means. When an incident is detected, it should be escalated to the appropriate individuals or teams responsible for incident management.

2. Incident Response : Activate the incident response process and assemble the incident response team. The team should consist of individuals with the necessary skills and knowledge to address the specific incident. Assign roles and responsibilities to team members, ensuring clear communication channels and collaboration.

3. Incident Triage : Assess the impact and severity of the incident. Gather relevant information about the incident, such as symptoms, error messages, and affected components or services. Prioritize incidents based on their potential impact on users, business operations, or system stability.

4. Mitigation and Resolution : Take immediate steps to mitigate the incident and minimize its impact. This may involve actions like restarting services, applying quick fixes, rolling back changes, or implementing workarounds. Work systematically to resolve the incident and restore normal operations. Document all actions taken during the incident response process.

5. Communication and Stakeholder Management : Maintain open and transparent communication throughout the incident. Keep stakeholders, including users, customers, and relevant internal teams, informed about the incident's status, impact, and progress toward resolution. Provide regular updates until the incident is fully resolved.
6. Post-Incident Analysis and Root Cause Analysis : Conduct a thorough post-incident analysis to identify the root cause(s) and contributing factors. Explore why the incident occurred, what could have been done to prevent it, and how similar incidents can be avoided in the future. This analysis may involve reviewing system logs, performing code reviews, examining configurations, or engaging in other investigative activities.

7. Remediation and Preventive Measures : Based on the findings from the post-incident analysis, implement corrective actions and preventive measures to address the root causes and prevent recurrence. This may involve making code or configuration changes, enhancing monitoring and alerting systems, improving documentation, or revising processes and procedures.

8. Incident Documentation and Knowledge Sharing : Document all relevant information related to the incident, including incident details, actions taken, resolutions, and lessons learned. Share this knowledge with the incident response team, other relevant teams, and stakeholders to improve incident response capabilities and contribute to organizational learning.

9. Continuous Improvement : Continuously refine and improve incident management processes based on feedback and lessons learned from incidents. Regularly review and update incident response playbooks, guidelines, and procedures to ensure they align with the evolving needs of the system and the organization.
Monitoring success in a Site Reliability Engineering (SRE) role involves assessing various metrics and indicators that demonstrate the effectiveness of the SRE practices and their impact on system reliability and performance. Here are some key aspects to consider when monitoring success in an SRE role:

1. Service Level Objectives (SLOs) Achievement : SLOs define the reliability and performance goals for a service. Monitoring the achievement of SLOs is crucial in assessing the success of an SRE team. If SLOs are consistently met or exceeded, it indicates that the system is reliable and performs well according to user expectations.

2. Incident Response Metrics : Incident response metrics provide insights into the effectiveness of the team in managing and resolving incidents. Key metrics include mean time to detect (MTTD), mean time to acknowledge (MTTA), and mean time to resolve (MTTR). Monitoring these metrics helps track the team's responsiveness, efficiency in incident resolution, and overall incident management effectiveness.

3. System Availability and Downtime Reduction : Monitoring system availability and tracking downtime is essential in evaluating the success of an SRE team. A reduction in unplanned outages and downtime demonstrates the team's efforts in improving system reliability and maintaining high availability.

4. Mean Time Between Failures (MTBF) : MTBF measures the average time between failures or incidents. Monitoring MTBF provides insights into the stability and reliability of the system. An increasing MTBF indicates improvements in system reliability and a decrease in the frequency of failures.

5. Mean Time to Recovery (MTTR) : MTTR measures the average time it takes to recover from incidents or failures. Monitoring MTTR helps assess the team's efficiency in resolving incidents and restoring normal system operations. A lower MTTR indicates faster incident resolution and reduced impact on system availability.
6. Capacity Planning and Scalability : Monitoring and evaluating the effectiveness of capacity planning and scalability efforts are important in an SRE role. Tracking resource utilization, performance metrics, and scaling activities helps ensure the system can handle anticipated growth and traffic spikes without performance degradation or service disruptions.

7. Continuous Improvement Initiatives : Success in an SRE role is also measured by the team's ability to drive continuous improvement. Monitoring the implementation and impact of initiatives such as automation, process optimization, and reliability engineering practices demonstrates the team's commitment to enhancing system reliability, performance, and operational efficiency over time.

8. User Satisfaction and Feedback : Collecting user feedback and monitoring user satisfaction metrics, such as Net Promoter Score (NPS) or customer surveys, provides valuable insights into the success of the SRE team. Positive feedback and high user satisfaction indicate that the system meets user expectations in terms of reliability, performance, and availability.

Monitoring success in an SRE role involves a combination of quantitative metrics, qualitative feedback, and ongoing assessment of the team's impact on system reliability and performance. Regularly reviewing and analyzing these metrics helps identify areas for improvement, measure progress, and ensure that SRE practices are aligned with business goals and user expectations.
Automation plays a critical role in Site Reliability Engineering (SRE) and is instrumental in achieving the goals of reliability, scalability, and efficiency. Here are some key aspects of automation in an SRE role:

1. Infrastructure Provisioning and Configuration : SREs use automation tools and scripts to provision and configure infrastructure resources. Infrastructure as Code (IaC) tools like Terraform or CloudFormation enable SREs to define infrastructure resources in a declarative manner, making it easier to manage and reproduce infrastructure setups. Automation allows for rapid and consistent provisioning of resources, reducing manual effort and the potential for human error.

2. Deployment and Release Management : Automation is vital for efficient and reliable software deployments. SREs leverage automation to streamline the deployment process, including building, packaging, and deploying applications. Continuous Integration/Continuous Deployment (CI/CD) pipelines automate the testing, packaging, and release of software, ensuring consistent and reliable deployments. Automation in this area helps minimize manual intervention, reduces deployment errors, and accelerates the release cycle.

3. Configuration Management : Automation tools like Puppet, Chef, or Ansible are used to manage and automate the configuration of systems and applications. SREs leverage these tools to enforce consistent configurations across the infrastructure, manage software dependencies, and ensure that systems are properly configured for optimal performance and reliability. Automation simplifies the management of complex configurations and enables rapid and consistent updates across multiple systems.

4. Monitoring and Alerting : Automation is essential for setting up robust monitoring and alerting systems. SREs use monitoring tools and frameworks to collect and analyze system metrics, log data, and other relevant information. Automation helps configure monitoring systems to collect the right metrics, set up thresholds and alerts, and automate incident notifications. Automated monitoring allows for proactive detection of issues, faster response times, and reduced manual effort in monitoring system health.
5. Incident Response and Remediation : Automation plays a crucial role in incident response and remediation. SREs use automation to facilitate incident detection, alerting, and initial diagnostics. Automated runbooks or playbooks can guide the response team through predefined steps for incident resolution, reducing the time to mitigate and recover from incidents. Automation enables faster incident triage, identification of root causes, and execution of remediation actions.

6. Scaling and Capacity Management : Automation is integral to scaling systems and managing capacity. SREs automate the provisioning and deprovisioning of resources based on demand, enabling dynamic scaling. Autoscaling features provided by cloud platforms or custom automation scripts can automatically adjust resources based on predefined thresholds or metrics. Automation in this area ensures that systems can handle varying workloads, optimize resource utilization, and maintain performance and availability.

7. Testing and Validation : Automation is used to conduct performance testing, load testing, and resilience testing. SREs automate the execution of test scenarios, simulating realistic user traffic and workload conditions. Automation tools enable the collection and analysis of performance metrics, helping identify performance bottlenecks, capacity constraints, and system weaknesses. Automated testing ensures reliable and repeatable validation of system performance and reliability.
While both SLA (Service Level Agreement) and SLO (Service Level Objective) are terms used to define the expected performance and reliability of a service, there are key differences between the two. Here's an explanation of each:

Service Level Agreement (SLA) :

An SLA is a formal contract or agreement between a service provider and its customers or users. It outlines the agreed-upon levels of service that the provider will deliver and the metrics that will be used to measure performance. SLAs typically include commitments regarding availability, response times, resolution times, and other relevant performance indicators.

Key characteristics of SLAs include :

* Agreement: SLAs are mutually agreed upon between the service provider and the customer or user. They establish the expectations and responsibilities of both parties.

* Contractual Nature: SLAs are legally binding contracts that specify the consequences of failing to meet the agreed-upon service levels. Penalties or remedies may be outlined in the SLA.

* Customer-Focused: SLAs primarily focus on the commitments made by the service provider to its customers or users. They define the level of service that customers can expect and the consequences if the service levels are not met.

* External-Facing: SLAs are typically external-facing documents that outline the service commitments made to customers or users. They are part of the customer-provider relationship and may be used for service procurement, pricing, and dispute resolution.

Service Level Objective (SLO) :

An SLO is a target or goal that defines the desired level of performance or reliability for a service. SLOs are typically set by the service provider and are used as internal benchmarks for monitoring and managing the service. SLOs are more granular and specific than SLAs and focus on measurable metrics that reflect the quality of service.

Key characteristics of SLOs include :

* Internal Benchmark: SLOs are internal objectives set by the service provider to measure and improve the performance and reliability of the service. They are not typically part of a contractual agreement with customers.

* Performance Measurement: SLOs define specific metrics and thresholds that are used to measure the performance and reliability of the service. These metrics could include availability, response times, error rates, throughput, or any other relevant indicators.

* Provider-Focused: SLOs are focused on the goals and objectives of the service provider. They provide targets for the internal teams responsible for managing and improving the service.

* Used for Monitoring and Improvement: SLOs are used as a basis for monitoring the actual performance of the service and driving continuous improvement. Deviations from the SLOs can trigger corrective actions and improvement initiatives.
DHCP stands for Dynamic Host Configuration Protocol. It is a protocol that allows networks to dynamically allocate IP addresses to hosts on the network.

DHCP is used to assign IP addresses to devices such as PCs and routers. When a device is installed, it may need an IP address in order to access the Internet. So when a new device is installed, it will get an IP address from DHCP so that it can connect to the network.

When a device connects to a network, it needs an IP address first so that it can communicate with other hosts on the network. And since most networks have only one IP address assigned for each device, there must be some mechanism for dynamically allocating those addresses.

In order for a DHCP server to work, it must have at least two parts: an interface (usually Ethernet or WiFi) and some sort of database that stores information about connections and users. Since an interface is required for each device connected, this database must contain all of the information about those devices and how they are connected. All of this data is then pulled together when a connection is requested.
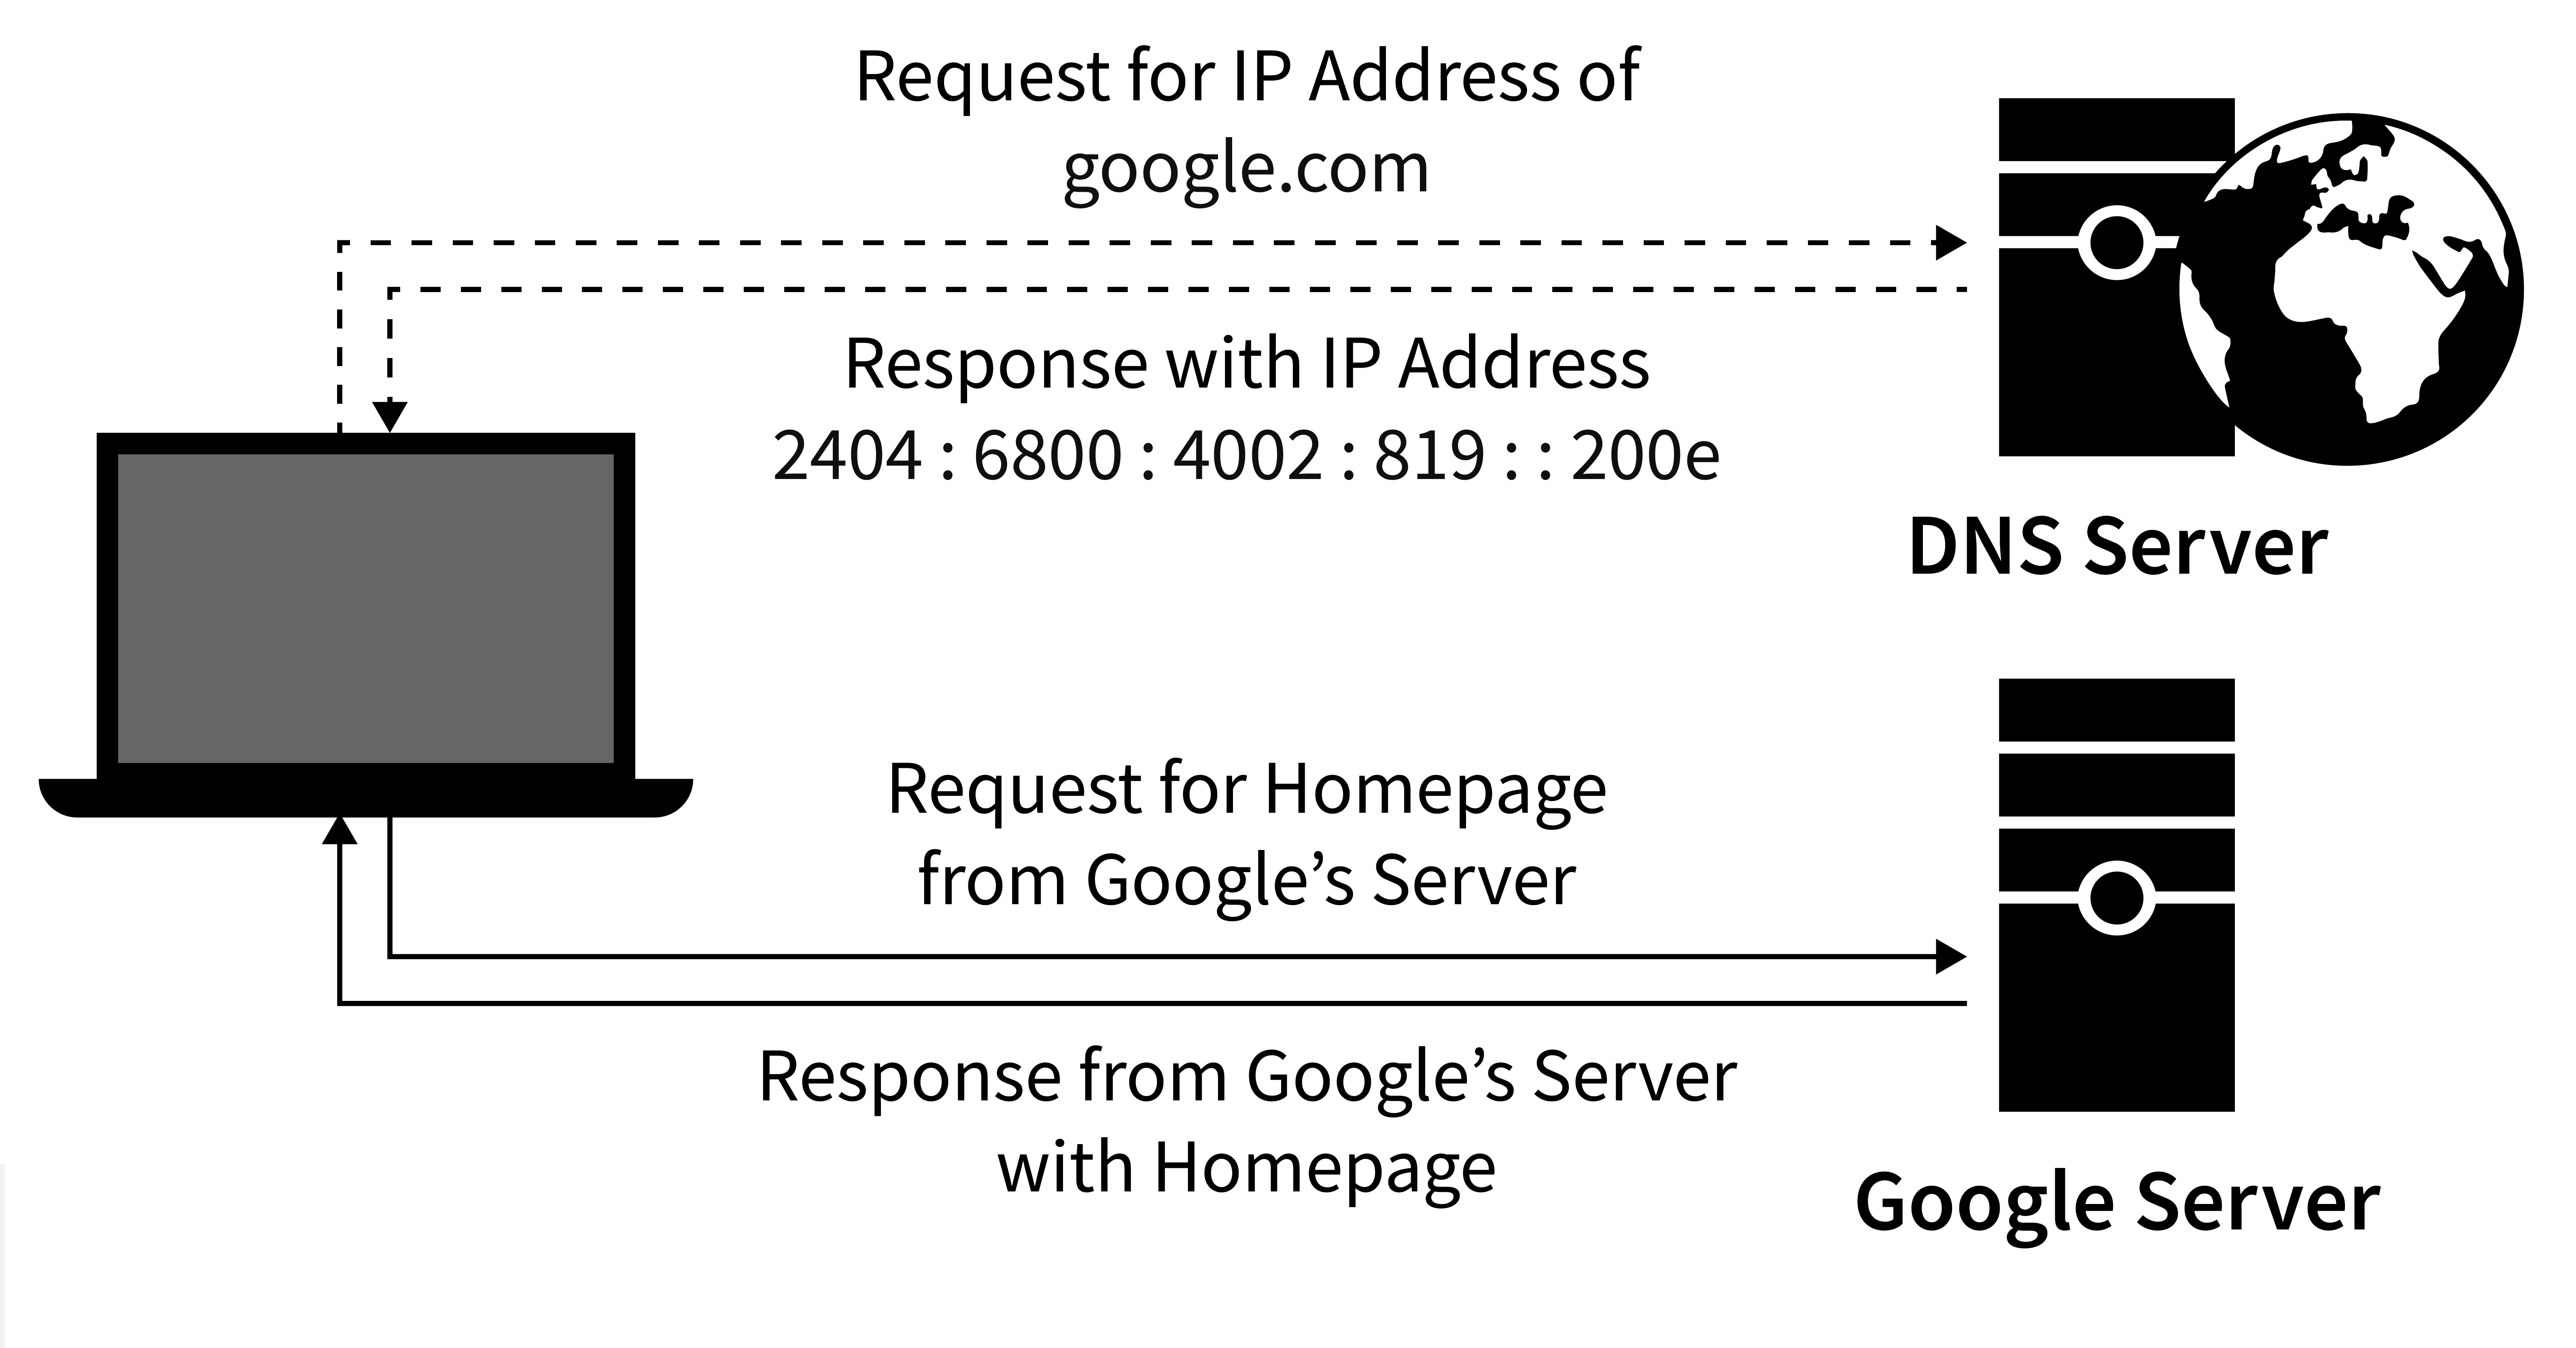
The DNS stands for Domain Name System. It is a mechanism that converts hostnames to IP addresses so that, when you type a website address into your browser, you can quickly identify the right server. Each domain name has one or more "resolvers," or IP addresses, associated with them by the DNS system.

When you enter a URL (such as www.google.com) into the browser, your computer requests the IP address connected with that web address from the DNS resolver. The IP address of a local machine or another server which has been set up to return that specific IP address is then returned to the browser by the DNS resolver.

Consider the below image for a better understanding :

DNS
DNS is necessary because hosts on the Internet have only human-readable names like google.com and not machine-readable names like 111.222.333.444. Without DNS, you would need to know how to interpret a URL's human-readable name in order to find it on the Internet, which would be very difficult without a centralized authority like Google to help you out!
ARP stands for Address Resolution Protocol. ARP is a protocol that allows devices on local networks to communicate with each other. It enables devices on the same network to find each other’s IP address, MAC address, and other network information. In short, it is used to automatically assign IP addresses to network devices so they can talk to each other.

This process occurs in 3 main stages :

* Discovering an IP address (ARP packets are sent out).

* Resolving an IP address (the device looks up the IP address using its own IP address table).

* Using a MAC address (the device looks up the MAC address using its own MAC address table).

ARP packets work by sending out a request to find any devices that have an IP address associated with them. The device receiving the packet will reply with its own list of IP addresses and other information. Each device maintains a table of known addresses so it knows how to resolve IP addresses when necessary.
Monitoring network operations is crucial for ensuring the reliability and performance of systems in a Site Reliability Engineering (SRE) role. Here are some common approaches and tools used to monitor network operations:

1. Network Performance Monitoring :
   * Network monitoring tools such as Nagios, Zabbix, or Prometheus can be used to track network performance metrics like latency, packet loss, bandwidth utilization, and throughput. These tools provide real-time visibility into network health and can generate alerts when performance metrics deviate from predefined thresholds.

2. Network Traffic Analysis :
   * Network traffic analysis tools like Wireshark or tcpdump help capture and analyze network packets. By examining packet-level details, SREs can identify network issues, troubleshoot problems, and understand the behavior of network protocols and applications.

3. Bandwidth Monitoring :
   * Bandwidth monitoring tools such as Cacti, PRTG, or SolarWinds track the usage of network bandwidth and provide insights into the amount of data flowing through the network. This helps identify any bandwidth constraints or unusual spikes in traffic.

4. Network Device Monitoring :
   * Network device monitoring tools like SNMP (Simple Network Management Protocol) or monitoring platforms with SNMP support enable monitoring of network devices such as routers, switches, firewalls, and load balancers. SNMP allows for the collection of device-specific metrics, such as CPU utilization, memory usage, interface status, and error rates.
5. Alerting and Notification :
   * Setting up alerts and notifications is crucial for timely response to network issues. Monitoring tools often provide the ability to define alerting rules based on predefined conditions or thresholds. Alerts can be configured to notify the operations team via email, SMS, or other notification channels when network metrics exceed acceptable levels.

6. Network Mapping and Visualization :
   * Network mapping tools help create visual representations of the network infrastructure, including devices, connections, and dependencies. These maps provide a holistic view of the network and aid in understanding the topology, identifying potential bottlenecks, and visualizing the impact of network failures.

7. Distributed Tracing :
   * Distributed tracing frameworks like Jaeger, Zipkin, or OpenTelemetry help monitor and trace requests as they traverse across multiple network services and components. These tools provide end-to-end visibility into the path and performance of requests, enabling SREs to identify latency issues, troubleshoot bottlenecks, and optimize the performance of distributed systems.

8. Network Security Monitoring :
   * Network security monitoring tools, such as intrusion detection systems (IDS) or security information and event management (SIEM) platforms, are used to detect and analyze network-based security threats and anomalies. These tools help identify potential security breaches, network attacks, or suspicious behavior.

SREs should assess the needs of their systems and leverage a combination of these monitoring approaches to gain comprehensive visibility into network operations, proactively detect issues, and ensure the reliability and performance of the network infrastructure.
The concept of "cattle, not pets" is a metaphor used in the context of infrastructure management, particularly in the realm of cloud computing and DevOps practices. It emphasizes treating infrastructure resources as disposable and replaceable entities rather than long-lived, individually maintained entities. Here's an explanation of the concept:

1. Pets : In traditional infrastructure management approaches, servers and systems are often treated as "pets." They are given individual attention, care, and customization. Admins invest significant time and effort in configuring, patching, and maintaining them. If a pet server experiences an issue, it may require troubleshooting and manual intervention to fix it, leading to potential downtime and operational challenges.

2. Cattle : The "cattle" metaphor represents a different approach. In this context, infrastructure resources are considered to be replaceable and expendable, similar to a herd of cattle. Rather than focusing on individual instances, administrators focus on managing large groups of identical or similar instances.

Key aspects of the "cattle" approach include :

* Automation: Infrastructure is provisioned, configured, and managed through automated tools and processes. This enables consistent and reproducible deployments and reduces the need for manual intervention.

* Immutable Infrastructure: Instead of making changes directly on running instances, new instances are created from predefined configurations. When updates or changes are required, new instances are created and the old ones are decommissioned. This ensures a consistent and controlled environment and eliminates configuration drift.

* Scalability and Resilience: The "cattle" approach allows for easy scaling by adding or removing instances based on demand. It also enhances resilience as individual instances can be replaced quickly if they experience issues.

* Monitoring and Metrics: Since instances are treated as a group, monitoring and metrics focus on aggregate statistics rather than individual instance-level details. Monitoring tools provide insights into the health and performance of the overall system rather than drilling down to each specific instance.

The "cattle, not pets" philosophy promotes scalability, automation, and resilience by shifting the mindset from individual server management to managing infrastructure as a whole. By treating instances as disposable and maintaining a focus on automation, organizations can achieve greater operational efficiency, faster deployments, and more reliable infrastructure.
Handling cascading failures or incidents that impact multiple services requires a systematic and coordinated approach to minimize the impact, restore services, and prevent further escalation. Here are some steps to handle such situations effectively:

1. Incident Triage and Communication :
   * Quickly identify and acknowledge the scope and severity of the incident. Assess the affected services, components, and dependencies.
   * Activate the incident response team and establish clear communication channels for collaboration and updates.
   * Notify relevant stakeholders, including customers or users, about the incident and provide regular updates on the progress of resolution efforts.

2. Root Cause Analysis :
   * Conduct a thorough investigation to identify the root cause(s) of the cascading failures. Analyze logs, metrics, and any available diagnostic information.
   * Determine the initial trigger event and understand the chain of events that led to the widespread impact.
   * Document the findings and share them with the team to prevent similar incidents in the future.

3. Mitigation and Service Restoration :
   * Prioritize service restoration based on criticality and impact. Identify dependencies and start with recovering services that will have the most significant positive impact.
   * Implement temporary workarounds, if feasible, to restore critical functionalities and minimize customer impact.
   * Collaborate with relevant teams (development, infrastructure, networking, etc.) to resolve underlying issues causing the cascading failures.
   * Conduct thorough testing and validation before bringing services back online to ensure stability and prevent recurrence.
4. Communication and Transparency :
   * Provide regular and transparent updates to stakeholders, including customers, about the progress of incident resolution and service restoration.
   * Share the steps being taken to prevent similar incidents in the future and provide a post-incident analysis report when appropriate.

5. Post-Incident Review and Remediation :
   * Conduct a comprehensive post-incident review to understand the factors that contributed to the cascading failures.
   * Identify gaps in monitoring, detection, and mitigation processes, and address them to improve future incident response.
   * Implement preventive measures and safeguards, such as improved monitoring, failover mechanisms, load balancing, and architectural changes, to minimize the likelihood and impact of similar incidents in the future.

6. Continuous Improvement :
   * Foster a culture of continuous improvement by encouraging knowledge sharing, learning from incidents, and implementing feedback loops.
   * Regularly review and update incident response plans and procedures to incorporate lessons learned from cascading failures and improve resilience.

Handling cascading failures requires a collaborative effort, effective communication, and a proactive approach to identify and resolve issues promptly. By having robust incident response processes, conducting thorough investigations, and implementing preventive measures, organizations can minimize the impact of such incidents and enhance the overall reliability of their systems.
LILO (Linux Loader) is a bootloader for Linux that is used to load Linux into memory and start the operating system. It is also known as a boot manager since it allows a computer to dual boot.

It can act as a master boot program or a secondary boot program, and it performs a variety of tasks such as locating the kernel, identifying other supporting programs, loading memory, and launching the kernel.

If you wish to utilize Linux OS, you must install a special bootloader called LILO, which allows Linux OS to boot quickly.
Linux Shell is an integral part of the Linux OS. The Linux OS is a free and open-source OS developed by Linus Torvalds. It is the most popular OS to run on servers and embedded devices. A Linux shell is a command line interface that allows the user to interact with the system. The command line interface (CLI) of Linux provides a text-based interface for executing commands, performing file management tasks, and issuing other system commands.

There are two types of shells in Linux :

* Interactive shell - It starts automatically when a user logs into their computer.

* Non-Interactive shell -  It can be started manually for the execution of any program.

These two types allow different users to have access to different sets of commands, depending on whether they are logged in or not. In most cases, non-interactive shells are used for administrative tasks such as managing user accounts and managing applications or services.

On a typical Linux system, the following shells are widely used :

* KSH (Korn Shell)
* ZSH
* TCSH
* CSH (C Shell)
* Bourne Shell
* BASH (Bourne Again Shell)
In the context of Site Reliability Engineering (SRE), the `kill` command in Linux can be a useful tool for managing and troubleshooting systems. SREs may utilize the `kill` command in various scenarios to address performance issues, handle misbehaving processes, or recover from incidents. Here are a few common use cases of the `kill` command in an SRE role:

1. Terminating Unresponsive Processes : When a process becomes unresponsive or hangs, it can impact system performance or cause resource contention. SREs may employ the `kill` command with the appropriate signal (such as `SIGTERM` or `SIGKILL`) to terminate the unresponsive process, allowing the system to recover and resume normal operation.

2. Graceful Service Shutdown : During maintenance or deployments, SREs may need to gracefully shut down services or applications. By sending the `SIGTERM` signal to the relevant process using the `kill` command, SREs can trigger a controlled shutdown, allowing the application to complete ongoing tasks and release resources before exiting.

3. Managing Process Lifecycle : SREs often work with processes running on servers, such as background daemons or service components. The `kill` command enables SREs to manage the lifecycle of these processes, starting or stopping them as needed, monitoring their behavior, or triggering specific actions by sending appropriate signals.

4. Signal Handling and Troubleshooting : SREs may use the `kill` command to troubleshoot issues with signal handling in processes. By sending specific signals (e.g., `SIGUSR1` or `SIGHUP`) to a process, SREs can trigger specific behaviors, such as generating diagnostic logs or triggering custom actions, aiding in debugging or troubleshooting efforts.

5. Resource Management : In certain cases, processes may consume excessive system resources, impacting overall system performance. SREs can leverage the `kill` command to terminate or restart resource-intensive processes, freeing up system resources and ensuring smooth operation.

It's important to exercise caution when using the `kill` command, especially with the `SIGKILL` signal, as it forcefully terminates a process without allowing it to perform any cleanup. Proper understanding of the signals and their impact on different processes is essential to prevent unintended consequences or data loss.
A “/proc” file system is a special type of file system that has special access permissions. It is mounted in Linux systems when the kernel needs to execute a process or access certain system resources.

A /proc directory contains information about the current state of the system, such as memory usage and CPU speed.

There are three subdirectories under /proc :

/proc/1 : This is the first subdirectory in the /proc directory tree. It contains information about the CPU and its speed.

/proc/1/cmdline : This subdirectory contains the command line parameters passed to the currently running process.

/proc/1/maps : This subdirectory contains virtual memory map data for processes running on Linux systems. It can be used to determine which parts of the memory are being used by which process.
OOPs is a programming paradigm that encourages the creation of objects to represent real-world entities and these objects are then used to perform tasks. These can be useful in designing a Server because they allow you to break down the tasks into manageable chunks, which will help you to keep your Server under control. As well as this, OOPs allows you to create reusable code which will save time and money.

When designing a Server using OOPs, it’s important to follow some basic design principles.

* The first of these is the Single Responsibility Principle (SRP). This states that each object should have one and only one reason to exist. For example, if you’re creating an Order Repository, it should only be responsible for one thing -- processing orders. This will help ensure that your code is easy to read and maintain.

* The second principle is the Open/Closed Principle (OCP), which states that an object should be either open for addition or closed for modification. For example, if you’re creating an Order Repository, it should be able to accept new orders but not modify existing ones.
A CDN (Content Delivery Network) is a network of servers that stores and distributes content to clients. These servers are typically located in data centres, and they can be used to improve performance by reducing latency, ensuring that the content is available at the right time, and ensuring that the content is delivered in a timely manner.

CDNs are most commonly used to store static content, such as images and videos, but they can also be used to store dynamic content, such as HTML or JavaScript. CDNs can also be used to deliver content from one location to another, such as from a website to a mobile device.

CDNs are an important part of the Internet infrastructure because they allow content to be stored and distributed in a more efficient way. They also allow content to be served from multiple locations, which can improve performance and reduce latency.

There are numerous applications for CDN, including :

* By giving static content a central location.
* By giving dynamic content a central location.
* Giving content from several sources a central spot.
* Giving material from several data centers a central location.
* Giving essential infrastructure elements, such servers and routers, redundancy.

Due to their role in ensuring that the Internet functions properly for everyone, CDNs are a crucial component of the Internet infrastructure. They aid in ensuring that everyone has simultaneous access to the same information.
SLO stands for Service Level Objective. It is a key concept in Site Reliability Engineering (SRE) and is used to define and measure the level of service reliability and performance that a system or service should achieve.

An SLO represents a specific target or goal for a particular aspect of a service, typically related to its availability, performance, or responsiveness. It helps set clear expectations for the service's performance and defines the level of reliability that users or customers can expect.

Here are a few important points about SLOs :

1. Quantifiable Metrics : SLOs are defined using quantifiable metrics that can be measured objectively. For example, an SLO might specify a target percentage of uptime (e.g., 99.9% availability) or a maximum acceptable response time (e.g., 200 milliseconds).

2. User-Centric Focus : SLOs are typically defined from the perspective of the service's users or customers. They represent the service's performance as experienced by the users and reflect their expectations and requirements.
3. Agreement and Commitment : SLOs are often established through agreements or contracts between the service provider (e.g., an organization or a team) and its users or customers. They define the level of service that the provider commits to deliver and the users can expect.

4. Monitoring and Measurement : SLOs require monitoring and measurement of relevant metrics to assess whether the service is meeting its objectives. Monitoring systems are set up to collect data and provide insights into the service's performance against the defined SLOs.

5. Error Budget : SLOs are often associated with an error budget, which represents the allowed or acceptable level of service degradation or incidents. The error budget specifies the threshold beyond which the service is considered to be in violation of its SLOs.

6. Iterative Improvement : SLOs are not set in stone. They can be refined and adjusted over time based on user feedback, changing requirements, or evolving business needs. SRE teams actively monitor SLO performance and work towards continuous improvement.

SLOs play a crucial role in driving reliability and customer satisfaction. They provide a clear target for service performance, guide decision-making in capacity planning, system design, and incident response, and help prioritize engineering efforts to achieve and maintain the desired level of service quality.
Service Level Indicators (SLIs) are measurable metrics or parameters that reflect specific aspects of a service's behavior or performance. SLIs are used to quantitatively assess the service's health, quality, and compliance with Service Level Objectives (SLOs). SLIs help provide objective data about the service's performance, which can be monitored, analyzed, and used to make informed decisions.

Here are a few important points about SLIs :

1. Measurable Metrics : SLIs are defined using measurable metrics that capture relevant aspects of the service's behavior. Examples of SLIs include response time, error rate, throughput, availability, latency, or any other quantifiable attributes that reflect the desired qualities of the service.

2. Quantitative Representation : SLIs provide a quantitative representation of the service's performance. They are often expressed as numerical values, percentages, ratios, or counts, allowing for objective measurement and comparison.

3. Relationship with SLOs : SLIs are closely tied to Service Level Objectives (SLOs). SLOs define the desired performance targets or thresholds for specific SLIs. SLIs help monitor the actual performance of the service and determine whether it meets the defined SLOs.
4. Monitoring and Data Collection : SLIs require a robust monitoring and data collection system to continuously track and record the relevant metrics. Monitoring tools and systems collect data from the service's infrastructure, applications, and user interactions to derive the values for SLIs.

5. Analysis and Visualization : SLI data is analyzed and visualized to gain insights into the service's performance trends, patterns, and anomalies. Visual representations, such as graphs, dashboards, or alerts, help teams monitor SLIs in real-time, identify deviations from the desired levels, and take appropriate actions.

6. Diagnostic and Troubleshooting : SLIs play a crucial role in identifying performance issues, diagnosing root causes, and troubleshooting problems. When SLIs deviate from the expected values, SRE teams can investigate further to understand the underlying reasons and take remedial actions.

By monitoring SLIs, teams can gain visibility into the service's performance, make data-driven decisions, and identify areas for improvement. SLIs provide a quantitative basis for discussions, incident response, capacity planning, and continuous improvement efforts, helping to maintain and enhance the quality and reliability of the service.
"Mean Time to Detect" (MTTD) and "Mean Time to Recover" (MTTR) are two key metrics used in incident management and service reliability assessment. They provide insights into the efficiency and effectiveness of incident response processes.


1. Mean Time to Detect (MTTD) :

   * MTTD measures the average time it takes to detect an incident or anomaly from the moment it occurs until it is recognized by the monitoring or alerting system. MTTD is an important metric as it represents the speed and effectiveness of monitoring, detection, and alerting mechanisms in identifying issues.

   * A low MTTD indicates that incidents are promptly detected, allowing for faster response and minimizing potential impacts. Organizations strive to minimize MTTD by implementing robust monitoring systems, proactive alerting mechanisms, and efficient incident detection processes.

2. Mean Time to Recover (MTTR) :

   * MTTR measures the average time it takes to recover from an incident or service disruption, starting from the moment the incident is detected until the service is fully restored and functioning as expected. MTTR includes all the necessary steps to analyze, troubleshoot, mitigate, and restore the affected systems or services.

   * A low MTTR indicates that incidents are resolved quickly, minimizing downtime and reducing the impact on users or customers. Organizations focus on reducing MTTR by implementing efficient incident response processes, well-defined escalation paths, effective collaboration, and automation where possible.

Monitoring and continuously improving MTTD and MTTR are crucial for maintaining high service availability, reducing customer impact, and enhancing overall reliability. By analyzing these metrics and identifying opportunities for optimization, organizations can refine their incident management processes, invest in automation and tooling, and develop skills to respond to incidents more effectively.

MTTD and MTTR should be analyzed in conjunction with other metrics, such as the severity of incidents, user impact, and the root cause analysis, to gain a comprehensive understanding of the incident management process and identify areas for improvement.
A TCP connection state is a relationship between a client TCP endpoint and a server TCP endpoint. These states are defined by the TCP three-way handshake process.

The three-way handshake process allows TCP to establish a connection between two endpoints, where one side initiates a connection setup using an SYN packet, while the other side responds with an ACK packet.

Once both sides have sent and received their respective SYN and ACK packets, an established connection is created. After the connection is established, a client can initiate data transfer over this connection by initiating a FIN packet, which will cause the server to send back an ACK packet indicating that all outstanding data has been successfully received and stored in memory. This process of sending and receiving packets works as long as there is no unexpected network congestion or other unforeseen events that cause either side to disconnect.

The different states of a TCP connection are defined as follows :

* LISTEN - The server is listening on a certain port, such as port 80 for HTTP.

* SYNC-SENT - Sent an SYN request and is awaiting a response.

* RECEIVED SYN - (Server) Waiting for an ACK occurs after the server sends an ACK.

* ESTABLISHED - The three-way TCP handshake has been finished.
By adding several logical resources, a system's size can be increased horizontally. To do this, either more virtual machines or containers can be added to each host. Additionally, it is possible by adding many hosts at once. This is also known as scaling out. as a result of the increase in systems.

Horizontal scaling preferred :

Due to the system's load and running time. This is expandable. Horizontal scaling (scaling-out) has the following benefits:

* It needs less money up front.
* It lowers administrative costs
* Facilitates simpler scalability as demand rises.
Site Reliability Engineering (SRE) teams rely on a variety of tools to support their work and fulfill their responsibilities. The specific tools used may vary depending on the organization, technology stack, and specific needs of the SRE team. Here are some common categories of tools that SREs often utilize:

1. Monitoring and Observability Tools :
   * Prometheus: A popular open-source monitoring and alerting system.
   * Grafana: A visualization and analytics platform used for monitoring and metric analysis.
   * Datadog: A cloud monitoring and observability platform with various integrations and analytics capabilities.
   * New Relic: An application performance monitoring (APM) tool providing real-time insights into application behavior.

2. Incident Management and Collaboration Tools :
   * PagerDuty: An incident management platform for alerting, on-call scheduling, and response orchestration.
   * Jira: A popular issue tracking and project management tool often used for incident management and task tracking.
   * Slack: A team collaboration platform for real-time communication and incident response coordination.
   * Microsoft Teams: A communication and collaboration platform commonly used for incident response and team collaboration.

3. Configuration Management and Infrastructure Provisioning Tools :
   * Ansible: An open-source automation tool for configuration management, application deployment, and infrastructure provisioning.
   * Terraform: An infrastructure as code (IaC) tool used to provision and manage cloud resources and infrastructure.
   * Puppet: A configuration management tool for automating infrastructure deployment, configuration, and management.
   * Chef: A configuration management tool for infrastructure automation and application deployment.
4. Version Control and Code Collaboration Tools :
   * Git: A distributed version control system widely used for code management and collaboration.
   * GitHub: A web-based hosting service for Git repositories, often used for version control, code review, and collaboration.
   * Bitbucket: A Git-based code collaboration platform that supports code hosting, version control, and pull requests.

5. Incident Response and Postmortem Tools :
   * Incident.io: An incident response and management tool designed to streamline incident communication, coordination, and resolution.
   * PostHog: A tool for tracking and analyzing user behavior, often used in incident investigations and postmortems.
   * Miro: A digital whiteboard and collaboration tool used for visualizing incidents, conducting postmortems, and documenting action items.

6. Automation and Orchestration Tools :
   * Jenkins: An open-source automation server used for continuous integration, deployment, and delivery (CI/CD) pipelines.
   * Kubernetes: An open-source container orchestration platform widely used for deploying and managing containerized applications.
   * AWS Lambda: A serverless computing service that allows running code without provisioning or managing servers.
   * Google Cloud Functions: A serverless execution environment for building and running event-driven applications.
Inodes are the units of storage on a Linux filesystem. Every file, directory, and block device has an inode associated with it, which is essentially a pointer to where the file is located in the filesystem. Inodes also have other properties such as their size and owner and group ID. If a file or directory is deleted, the inode will be marked as deleted and all data associated with that inode will be removed as well.

Inodes are an important resource for both performance and security. There are a number of reasons why they can be important:

* For performance, inodes are used to determine how much space a file occupies, so they can be used to optimize the placement of files that are likely to change frequently. When a file is created or moved between partitions, it must go through the inode stage first.

* For security, there are two main roles for inodes: indexing and ACLs (access control lists).

* Indexing allows tools like locate or grep to quickly find files by name or location.

* ACLs allow users to control access to their files based on permissions assigned by their system administrator.

In addition, having all files written to disk as soon as they are modified can help prevent data loss due to power outages or other unforeseen events.

Finally, while most people might assume that inodes are used primarily for storing data on disk drives, Inodes are also used to track metadata about every file on your computer, as well as directories and other objects stored on your computer’s hard drive. This data is used to keep track of which files have been deleted, modified, or copied, and can also be used to determine the overall health and performance of your computer.
Redundant Array of Independent Disks (RAID) is a technology used in data storage systems to improve data availability, fault tolerance, and performance. It involves combining multiple physical disk drives into a single logical unit to achieve better reliability and performance than a single disk alone.

RAID works by distributing data across multiple drives in different ways, depending on the specific RAID level or configuration. Each RAID level offers a different combination of performance, fault tolerance, and capacity. Here are some commonly used RAID levels:

1. RAID 0 (Striping) :
   * Data is evenly distributed across multiple drives without redundancy.
   * Offers improved read and write performance as data can be accessed from multiple drives simultaneously.
   * No fault tolerance - if one drive fails, the entire array is affected, potentially leading to data loss.

2. RAID 1 (Mirroring) :
   * Data is mirrored between pairs of drives.
   * Provides data redundancy - if one drive fails, data is still accessible from the mirrored drive.
   * Read performance may be improved, but write performance is typically not enhanced.
   * Requires twice the storage capacity as data is duplicated on each drive.
3. RAID 5 (Block-Level Striping with Parity) :
   * Data is striped across multiple drives, and parity information is distributed across all drives.
   * Provides fault tolerance - if one drive fails, the data can be reconstructed using parity information and data from the remaining drives.
   * Offers good read performance and decent write performance.
   * Requires a minimum of three drives.

4. RAID 6 (Block-Level Striping with Double Parity) :
   * Similar to RAID 5, but with an additional parity drive for enhanced fault tolerance.
   * Can tolerate the failure of two drives simultaneously.
   * Provides better data protection and fault tolerance than RAID 5, but at the cost of reduced write performance.
   * Requires a minimum of four drives.

There are additional RAID levels, such as RAID 10 (a combination of RAID 1 and RAID 0), RAID 50 (a combination of RAID 5 and RAID 0), and RAID 60 (a combination of RAID 6 and RAID 0), which offer various trade-offs between performance, capacity, and fault tolerance.
SNAT (Source Network Address Translation) and DNAT (Destination Network Address Translation) are techniques used in computer networking to modify the source and destination IP addresses respectively in IP packets as they traverse a network.


1. SNAT (Source Network Address Translation) :

   * SNAT is a process of modifying the source IP address of outgoing packets to a different IP address.

   * It is commonly used in Network Address Translation (NAT) scenarios, where a private network with non-routable IP addresses needs to communicate with the public internet.

   * When a packet from a private network is sent to the public network, the NAT device replaces the private IP address in the source field with a public IP address that is routable on the internet.

   * This allows devices in the private network to communicate with external networks, as the external networks see the packet coming from the public IP address of the NAT device rather than the private IP address.
2. DNAT (Destination Network Address Translation) :

   * DNAT is a process of modifying the destination IP address of incoming packets to a different IP address.

   * It is often used to redirect incoming packets to different destinations, such as forwarding traffic to a specific server or load balancer within a private network.

   * When a packet arrives at a network device configured for DNAT, it examines the destination IP address and replaces it with a different IP address based on predefined rules.

   * This allows the device to redirect the packet to a different destination within the network, even though the packet was initially intended for a different IP address.

Both SNAT and DNAT are important techniques used in network infrastructure to enable efficient communication between different networks, especially when private networks need to connect with public networks or when traffic needs to be directed to specific destinations within a network. These techniques are commonly implemented in firewalls, routers, and load balancers to control and manipulate network traffic.
Scrum is an agile framework for software development that focuses on iterative and incremental delivery of products. It emphasizes cross-functional teams, collaboration, and adaptability.

Site Reliability Engineering (SRE) is a discipline that combines software engineering and operations to ensure the reliability, scalability, and performance of systems and services.

While Scrum and SRE are not directly related, it is possible to incorporate SRE principles and practices within a Scrum framework. Here are a few ways SRE can be integrated into Scrum :

1. SRE as a Scrum Team Member : In a Scrum team, an SRE engineer can be part of the development team, contributing their expertise in building and operating reliable systems. They collaborate with other team members, participate in sprint planning, and work on implementing SRE practices within the product development process.

2. Setting SRE Goals as Part of Sprint Planning : During sprint planning, the Scrum team can define specific SRE goals or tasks to be accomplished during the sprint. This could include activities such as improving monitoring, implementing automated deployment processes, or conducting reliability testing.

3. SRE as a Product Backlog Item : SRE-related tasks or user stories can be added to the product backlog. These could include items like enhancing system resilience, reducing mean time to detect incidents, or implementing incident response automation. The product owner, in collaboration with the team, can prioritize and plan the inclusion of SRE tasks in the sprint.

4. SRE Metrics and Feedback : SRE principles emphasize the importance of measuring and monitoring system performance and reliability. Scrum teams can incorporate SRE metrics, such as service level indicators (SLIs) and service level objectives (SLOs), into their sprint reviews and retrospectives. This helps the team gain insights into the reliability of the system and identify areas for improvement.
Virtualization is the process of using one physical system to run multiple virtual machines. It is commonly used by companies that want to consolidate computing resources and keep them running 24/7 without having to buy more hardware. Virtualization can also be used for testing purposes, such as for software development or system performance testing.

Virtualization can be used in a number of different ways, from simple setups where multiple virtual machines run on the same physical server, to complex setups that use multiple servers and virtual networks.

The end goal is always the same : reducing overhead costs and improving overall IT infrastructure efficiency. Virtualization can also be used to create hybrid environments where physical servers are augmented by cloud-based services.

There are many different types of virtualization technology available today, including :

* VMware - This is one of the most popular virtualization technologies available today. It runs on almost any platform and is easy to install and manage. It’s also very cost-effective because it leverages a lot of existing hardware and software infrastructure already in place.

* Windows Server - Windows Server is a common choice for virtualizing Microsoft applications because it has built-in support for Hyper-V, making it easy to deploy and manage. There are also several third-party solutions available to further augment administrator capabilities.

* Hyper-V - This is another option that’s popular with organizations looking to virtualize their servers. While it’s not as widely used as Hyper-V, it’s still an option that’s worth exploring if you’re looking for a low-cost way to virtualize. It’s one of the newer options available, so it might not be as widely accepted as the others but it’s still a valid option.
Mitigating the impact of a Distributed Denial of Service (DDoS) attack requires a coordinated and proactive response to protect the targeted system or network. Here are several steps that can be taken to mitigate the impact of a DDoS attack:

1. DDoS Preparedness :
   * Develop a DDoS response plan in advance, outlining roles, responsibilities, and communication channels for the response team.
   * Implement a DDoS detection and monitoring system to identify and analyze potential attacks.
   * Set up real-time traffic monitoring and anomaly detection tools to identify unusual traffic patterns.

2. Traffic Filtering and Rate Limiting :
   * Configure network devices, such as routers or firewalls, to implement traffic filtering and rate limiting rules.
   * Apply access control lists (ACLs) to block or drop traffic from suspicious or known malicious sources.
   * Implement rate limiting to restrict the flow of traffic and prevent overwhelming the system.

3. Content Delivery Network (CDN) :
   * Employ a CDN service to distribute traffic and absorb the impact of the DDoS attack.
   * The CDN can help filter out malicious traffic and redirect legitimate traffic to the target system.
4. Load Balancing and Scalability :
   * Utilize load balancing techniques to distribute traffic across multiple servers or resources.
   * Scaling up the infrastructure, such as adding more servers or increasing bandwidth, can help absorb and handle increased traffic during an attack.

5. Cloud-Based DDoS Protection :
   * Engage with a cloud-based DDoS protection service that specializes in mitigating large-scale attacks.
   * These services leverage their infrastructure and expertise to filter out malicious traffic and allow only legitimate traffic to reach the target system.

6. Incident Response and Communication :
   * Activate the incident response plan to coordinate the response efforts across different teams.
   * Establish clear communication channels to keep stakeholders, customers, and internal teams informed about the attack and the mitigation measures being taken.

7. Analyze and Learn :
   * Conduct a post-attack analysis to understand the attack vectors, traffic patterns, and vulnerabilities exposed during the attack.
   * Implement the necessary measures to strengthen the system's resilience against future DDoS attacks, such as updating security configurations, patching vulnerabilities, or improving network infrastructure.
The concept of "blast radius" refers to the potential impact or extent of damage that can occur when a failure or incident happens within a system or infrastructure. It is commonly used in the context of system design and architecture to assess the potential consequences of a failure and make informed decisions about mitigating risks.

The term "blast radius" draws an analogy to the area affected by an explosion. Just as an explosion has a radius within which its impact is felt, a failure or incident within a system can have a radius that determines the scope of its impact. The blast radius can encompass various dimensions, including the number of affected components, the number of users impacted, the geographical reach, and the severity of the consequences.

Here are a few reasons why considering blast radius is significant in system design :

1. Risk Assessment : By evaluating the blast radius, system designers can assess the potential impact of failures or incidents and identify areas of high risk. This helps prioritize efforts to mitigate and reduce the impact of failures.

2. Fault Isolation and Containment : Understanding the blast radius can guide the design of fault isolation mechanisms and containment strategies. By partitioning the system into smaller, independent components or services, failures can be confined within smaller blast radiuses, preventing widespread disruption.

3. Reducing Single Points of Failure : A system with a large blast radius is more susceptible to cascading failures. Designing systems with redundancy, failover mechanisms, and distributed architectures can help reduce the blast radius and prevent failures from spreading across the entire system.

4. Resilience and Recovery : By considering blast radius during system design, measures can be taken to enhance system resilience and recovery. This includes implementing backup and restore mechanisms, disaster recovery plans, and fast recovery strategies that minimize downtime and limit the blast radius in the event of a failure.

5. Incident Response Planning : The concept of blast radius is crucial in incident response planning. It helps in defining incident management procedures, escalation paths, and communication strategies, ensuring that the response is proportionate to the blast radius and the severity of the incident.
Handling a sudden spike in traffic or load on a service requires a proactive and swift response to ensure that the service remains available and responsive to users. Here are some steps you can take to handle such a situation effectively:

1. Monitor and Detect : Implement a robust monitoring system that continuously tracks key performance metrics such as CPU usage, memory utilization, network traffic, and response times. Set up alerts to notify you when traffic or load exceeds predefined thresholds. This helps in detecting spikes in traffic early on.

2. Scale Vertically : If the spike in traffic is sudden but temporary, scaling vertically by increasing the resources (e.g., CPU, memory) of the existing servers can help handle the increased load. This can be done by allocating more resources to the existing servers or by upgrading the hardware.

3. Scale Horizontally : If the traffic spike is sustained or the load exceeds the capacity of the current infrastructure, scaling horizontally by adding more servers or instances can help distribute the load. This can be achieved through auto-scaling mechanisms or manually provisioning additional resources.

4. Load Balancing : Implement a load balancing mechanism to evenly distribute incoming requests across multiple servers or instances. This helps prevent any single server from being overwhelmed by the spike in traffic.
5. Caching and Content Delivery Networks (CDNs) : Utilize caching techniques to store frequently accessed data or static content closer to the users. This reduces the load on the backend servers and improves response times. Additionally, leveraging CDNs can offload traffic by delivering static assets from geographically distributed servers.

6. Optimize Code and Queries : Analyze and optimize the application code and database queries to ensure efficient utilization of resources. Identify any bottlenecks or performance issues that could be contributing to the increased load and address them accordingly.

7. Prioritize Critical Functionality : During a spike in traffic, prioritize critical functionality or core features to ensure that essential services remain available and responsive. Consider temporarily disabling non-essential features or reducing the functionality to handle the increased load more effectively.

8. Communicate with Stakeholders : Keep stakeholders, such as customers, partners, and internal teams, informed about the situation and the steps being taken to handle the spike in traffic. Provide updates on the progress and expected resolution time to manage expectations and maintain transparency.

9. Conduct Post-Incident Analysis : After handling the spike in traffic, perform a post-incident analysis to identify the root causes, evaluate the effectiveness of the response, and implement any necessary improvements to prevent similar issues in the future.
Handling data backups and disaster recovery planning is crucial for ensuring the availability, integrity, and recoverability of data in the event of unexpected incidents or disasters. Here are some steps to handle data backups and disaster recovery planning effectively:

1. Identify Critical Data : Determine the critical data that needs to be backed up and protected. This includes data that is essential for the functioning of the system, sensitive customer information, transactional data, configuration files, and any other data that is critical for business operations.

2. Define Backup Strategies : Establish a backup strategy that aligns with the requirements of the organization. This involves deciding the frequency of backups (daily, weekly, etc.), choosing appropriate backup methods (full, incremental, differential), and determining the retention period for backups.

3. Select Backup Solutions : Choose suitable backup solutions or tools that fit the organization's needs. This may involve using disk-based backups, tape backups, cloud-based backups, or a combination of these. Consider factors such as data size, recovery time objectives (RTOs), and recovery point objectives (RPOs) while selecting the backup solutions.

4. Automate Backup Processes : Automate the backup processes to ensure consistency and reliability. Implement backup schedules and scripts that run automatically at the defined intervals, ensuring that the backups are performed without manual intervention.
5. Test Backup Restorations : Regularly test the backup restoration process to verify the integrity and usability of the backed-up data. This ensures that data can be recovered successfully in case of a disaster or data loss event. Perform both full and partial restores to validate the backup solution's effectiveness.

6. Offsite Storage : Store backups offsite to protect against physical damage or disasters that may affect the primary data center. Offsite storage can be achieved through cloud-based backup solutions, replication to secondary data centers, or physically transferring backup media to a secure location.

7. Implement Disaster Recovery Plan : Develop a comprehensive disaster recovery plan that outlines the steps to be taken in the event of a disaster. This plan should include recovery procedures, roles and responsibilities of the recovery team, communication protocols, and a clear escalation path.

8. Regularly Review and Update : Conduct periodic reviews of the backup and disaster recovery plans to ensure they remain up to date. This includes verifying that backup schedules, recovery procedures, and contact information are current and reflect any changes in the infrastructure or business needs.

9. Document and Communicate : Document the backup and disaster recovery processes, including the steps, configurations, and contact information, in a readily accessible and understandable format. Communicate the plan to relevant stakeholders, including the IT team, management, and other key personnel, to ensure everyone is aware of their roles and responsibilities during a disaster.

10. Continuous Improvement : Continuously evaluate and improve the backup and disaster recovery processes based on lessons learned from testing, incidents, and changes in the environment. Regularly assess the effectiveness of the backup solutions, update backup strategies as needed, and incorporate feedback and insights gained from recovery exercises.
Handling incidents in a customer-facing production environment requires a structured and effective incident management process to minimize the impact on customers and restore services as quickly as possible. Here are some steps to handle incidents in a customer-facing production environment:

1. Incident Response Plan : Develop a well-defined incident response plan in advance. This plan should outline roles, responsibilities, and communication channels for the incident response team. It should also define the severity levels of incidents and the corresponding escalation procedures.

2. Alerting and Monitoring : Implement a robust monitoring system that alerts the team about potential incidents or abnormal conditions in real-time. Set up alerts based on predefined thresholds for key performance metrics, error rates, response times, or other relevant indicators.

3. Incident Triage : Upon receiving an alert or notification, promptly triage the incident to determine its severity and impact on customers. Assign a dedicated incident owner who will take charge of managing the incident response.

4. Communication and Notification : Establish clear communication channels and notification processes to keep stakeholders informed about the incident. This includes notifying customers, internal teams, and relevant stakeholders about the incident, its impact, and the estimated time for resolution.
5. Incident Investigation and Diagnosis : Conduct a thorough investigation to identify the root cause of the incident. Use monitoring tools, log analysis, and any available diagnostic information to understand the underlying issue. This may involve collaborating with developers, system administrators, or other relevant teams to diagnose and resolve the problem.

6. Incident Mitigation : Once the root cause is identified, take necessary steps to mitigate the incident and restore services. This may involve implementing temporary workarounds, rolling back recent changes, applying fixes or patches, or scaling up resources to handle increased load.

7. Incident Resolution and Recovery : Work towards resolving the incident and restoring the affected services to normal operation. Communicate progress updates to stakeholders to manage expectations and provide transparency about the recovery process.

8. Post-Incident Analysis : Conduct a post-incident analysis or retrospective to learn from the incident and prevent similar issues in the future. Identify lessons learned, document the incident response process, and propose any necessary improvements to prevent recurrence.

9. Documentation and Knowledge Sharing : Document the incident details, actions taken, and resolutions for future reference. Share this knowledge within the team and across relevant departments to improve incident response capabilities and facilitate faster resolution of similar incidents in the future.

10. Continuous Improvement : Continuously evaluate and improve the incident management process based on feedback, lessons learned, and changes in the environment. Regularly review incident response plans, update escalation procedures, and incorporate insights gained from incident post-mortems.
Canary deployments play a crucial role in maintaining system reliability by introducing new features or changes gradually to minimize the risk of impacting the entire system. The primary purpose of canary deployments is to validate the changes in a controlled manner before fully rolling them out to all users or environments. Here's how canary deployments contribute to system reliability:

1. Controlled Rollout : Canary deployments allow for a controlled rollout of changes by initially deploying them to a small subset of users or a specific environment. This subset, often referred to as the "canary group," represents a representative sample of the user base or workload.

2. Early Detection of Issues : By exposing a small portion of users or traffic to the new changes, canary deployments provide an opportunity to monitor and detect any issues or anomalies that may arise. This includes performance issues, compatibility problems, or unexpected behavior. Early detection allows for quick mitigation or rollback, minimizing the impact on the wider user base.
3. A/B Testing and Experimentation : Canary deployments enable A/B testing and experimentation by comparing the behavior and performance of the new changes against the existing stable version. This helps gather insights on the impact of the changes, such as user engagement, conversion rates, or performance metrics, and make informed decisions on whether to proceed with the rollout.

4. Incremental Rollout : Once the canary group has been successfully validated, the deployment can be gradually expanded to a larger audience or environment. This incremental rollout reduces the risk of widespread issues and allows for iterative improvements based on real-world usage and feedback.

5. Rapid Rollback : In case any issues or anomalies are detected during the canary deployment, a rollback can be performed swiftly and precisely. By isolating the impact to a smaller group, the rollback process is easier and faster, minimizing the duration of potential disruptions.

6. Performance Monitoring and Analysis : Canary deployments provide an opportunity to closely monitor the performance and behavior of the changes in a real-world production environment. This data can be analyzed to assess the impact on system performance, resource utilization, error rates, and other key metrics. It helps in identifying potential bottlenecks, scalability concerns, or optimizations that can further enhance system reliability.
ARP (Address Resolution Protocol) is a communication protocol used in local area networks (LANs) to map an IP address to its corresponding MAC address. It allows devices on a network to discover and communicate with each other using their MAC addresses. Here's a detailed explanation of how ARP works:

1. IP Address and MAC Address Relationship :
   * Every device connected to a network has both an IP address and a MAC address. The IP address is a logical address assigned to the device, while the MAC address is a unique identifier assigned to the device's network interface card (NIC).

2. ARP Request :
   * When a device wants to communicate with another device on the same network, it checks its ARP cache (also known as ARP table) to see if it already has the MAC address for the corresponding IP address. If the MAC address is not found in the cache, the device initiates an ARP request.
   * The ARP request is a broadcast message sent to all devices on the local network. The request contains the sender's IP address and MAC address, as well as the target IP address for which the MAC address is being requested.

3. ARP Reply :
   * The device that matches the target IP address in the ARP request responds with an ARP reply. This reply is sent directly to the requesting device, and it contains the sender's IP address and MAC address.
   * The requesting device receives the ARP reply and updates its ARP cache with the IP-to-MAC mapping received in the reply.
4. ARP Cache :
   * Each device maintains an ARP cache, which is a table that stores the IP-to-MAC mappings it has learned through ARP requests and replies. The ARP cache helps devices avoid repeated ARP requests for frequently communicated devices on the network.
   * The ARP cache has an expiration time for each entry, after which the mapping is considered invalid. This ensures that devices can update the cache if the IP-to-MAC mapping changes.

5. Gratuitous ARP :
   * Gratuitous ARP is an ARP request or reply that is sent by a device without any preceding request. It is used to announce the IP-to-MAC mapping or to resolve conflicts on the network.
   * For example, when a device comes online or when it changes its IP address, it can send a gratuitous ARP to inform other devices about its new IP-to-MAC mapping.

6. Proxy ARP :
   * Proxy ARP is a feature where a device responds to ARP requests on behalf of another device. This is typically done by routers to help devices communicate across different networks.
   * When a device sends an ARP request for a target IP address that belongs to another network, the router acting as a proxy will respond with its own MAC address as if it were the target device. This allows the requesting device to send traffic to the router, which will then route the packets to the correct destination.

ARP plays a vital role in facilitating communication between devices on a local network by mapping IP addresses to MAC addresses. It allows devices to discover each other's MAC addresses dynamically, enabling efficient data transmission within the network.
Handling a situation where a third-party service your application relies on goes down requires a proactive approach to minimize the impact on your application and its users. Here are steps you can take to handle such a situation effectively:

1. Monitor Service Health : Implement monitoring for the third-party service to detect any downtime or performance issues. Use tools or services that provide alerts or notifications when the service becomes unavailable or experiences degradation.

2. Graceful Degradation : Design your application to gracefully handle the unavailability of the third-party service. Implement fallback mechanisms or alternative paths to ensure that your application can continue to function, albeit with reduced functionality or by providing alternative options to users.

3. Failover or Redundancy : If the third-party service is critical for your application, consider implementing failover mechanisms or redundant alternatives. This could involve using multiple service providers, replicating data, or having backup processes to ensure uninterrupted service even if one provider goes down.
4. Error Handling and Timeouts : Implement appropriate error handling and timeouts in your application's code when making requests to the third-party service. This allows your application to recover quickly if the service becomes unresponsive or experiences prolonged delays.

5. Communication and Status Updates : Communicate the issue to your users or stakeholders in a timely and transparent manner. Provide updates on the situation, estimated recovery time, and any workaround or alternative options available to users during the downtime.

6. Contingency Plans : Have contingency plans in place to address such situations. This could include having alternative service providers in mind, maintaining backup data or functionality, or having a procedure to switch to a backup system if the primary service remains unavailable for an extended period.

7. Collaboration with the Third-Party Service Provider : Establish communication channels with the third-party service provider to report and inquire about the issue. Collaborate with them to understand the cause, estimated resolution time, and any steps you can take to mitigate the impact on your application.

8. Continuous Monitoring and Improvement : Continuously review and enhance your application's resilience to third-party service outages. Analyze the incident post-mortem, identify areas for improvement, and implement changes to mitigate future risks. Regularly revisit your monitoring strategy and consider alternative services or approaches that could minimize the impact of service failures.